Material Fatigue
Glossary Of Terms
- Alternating stress
-
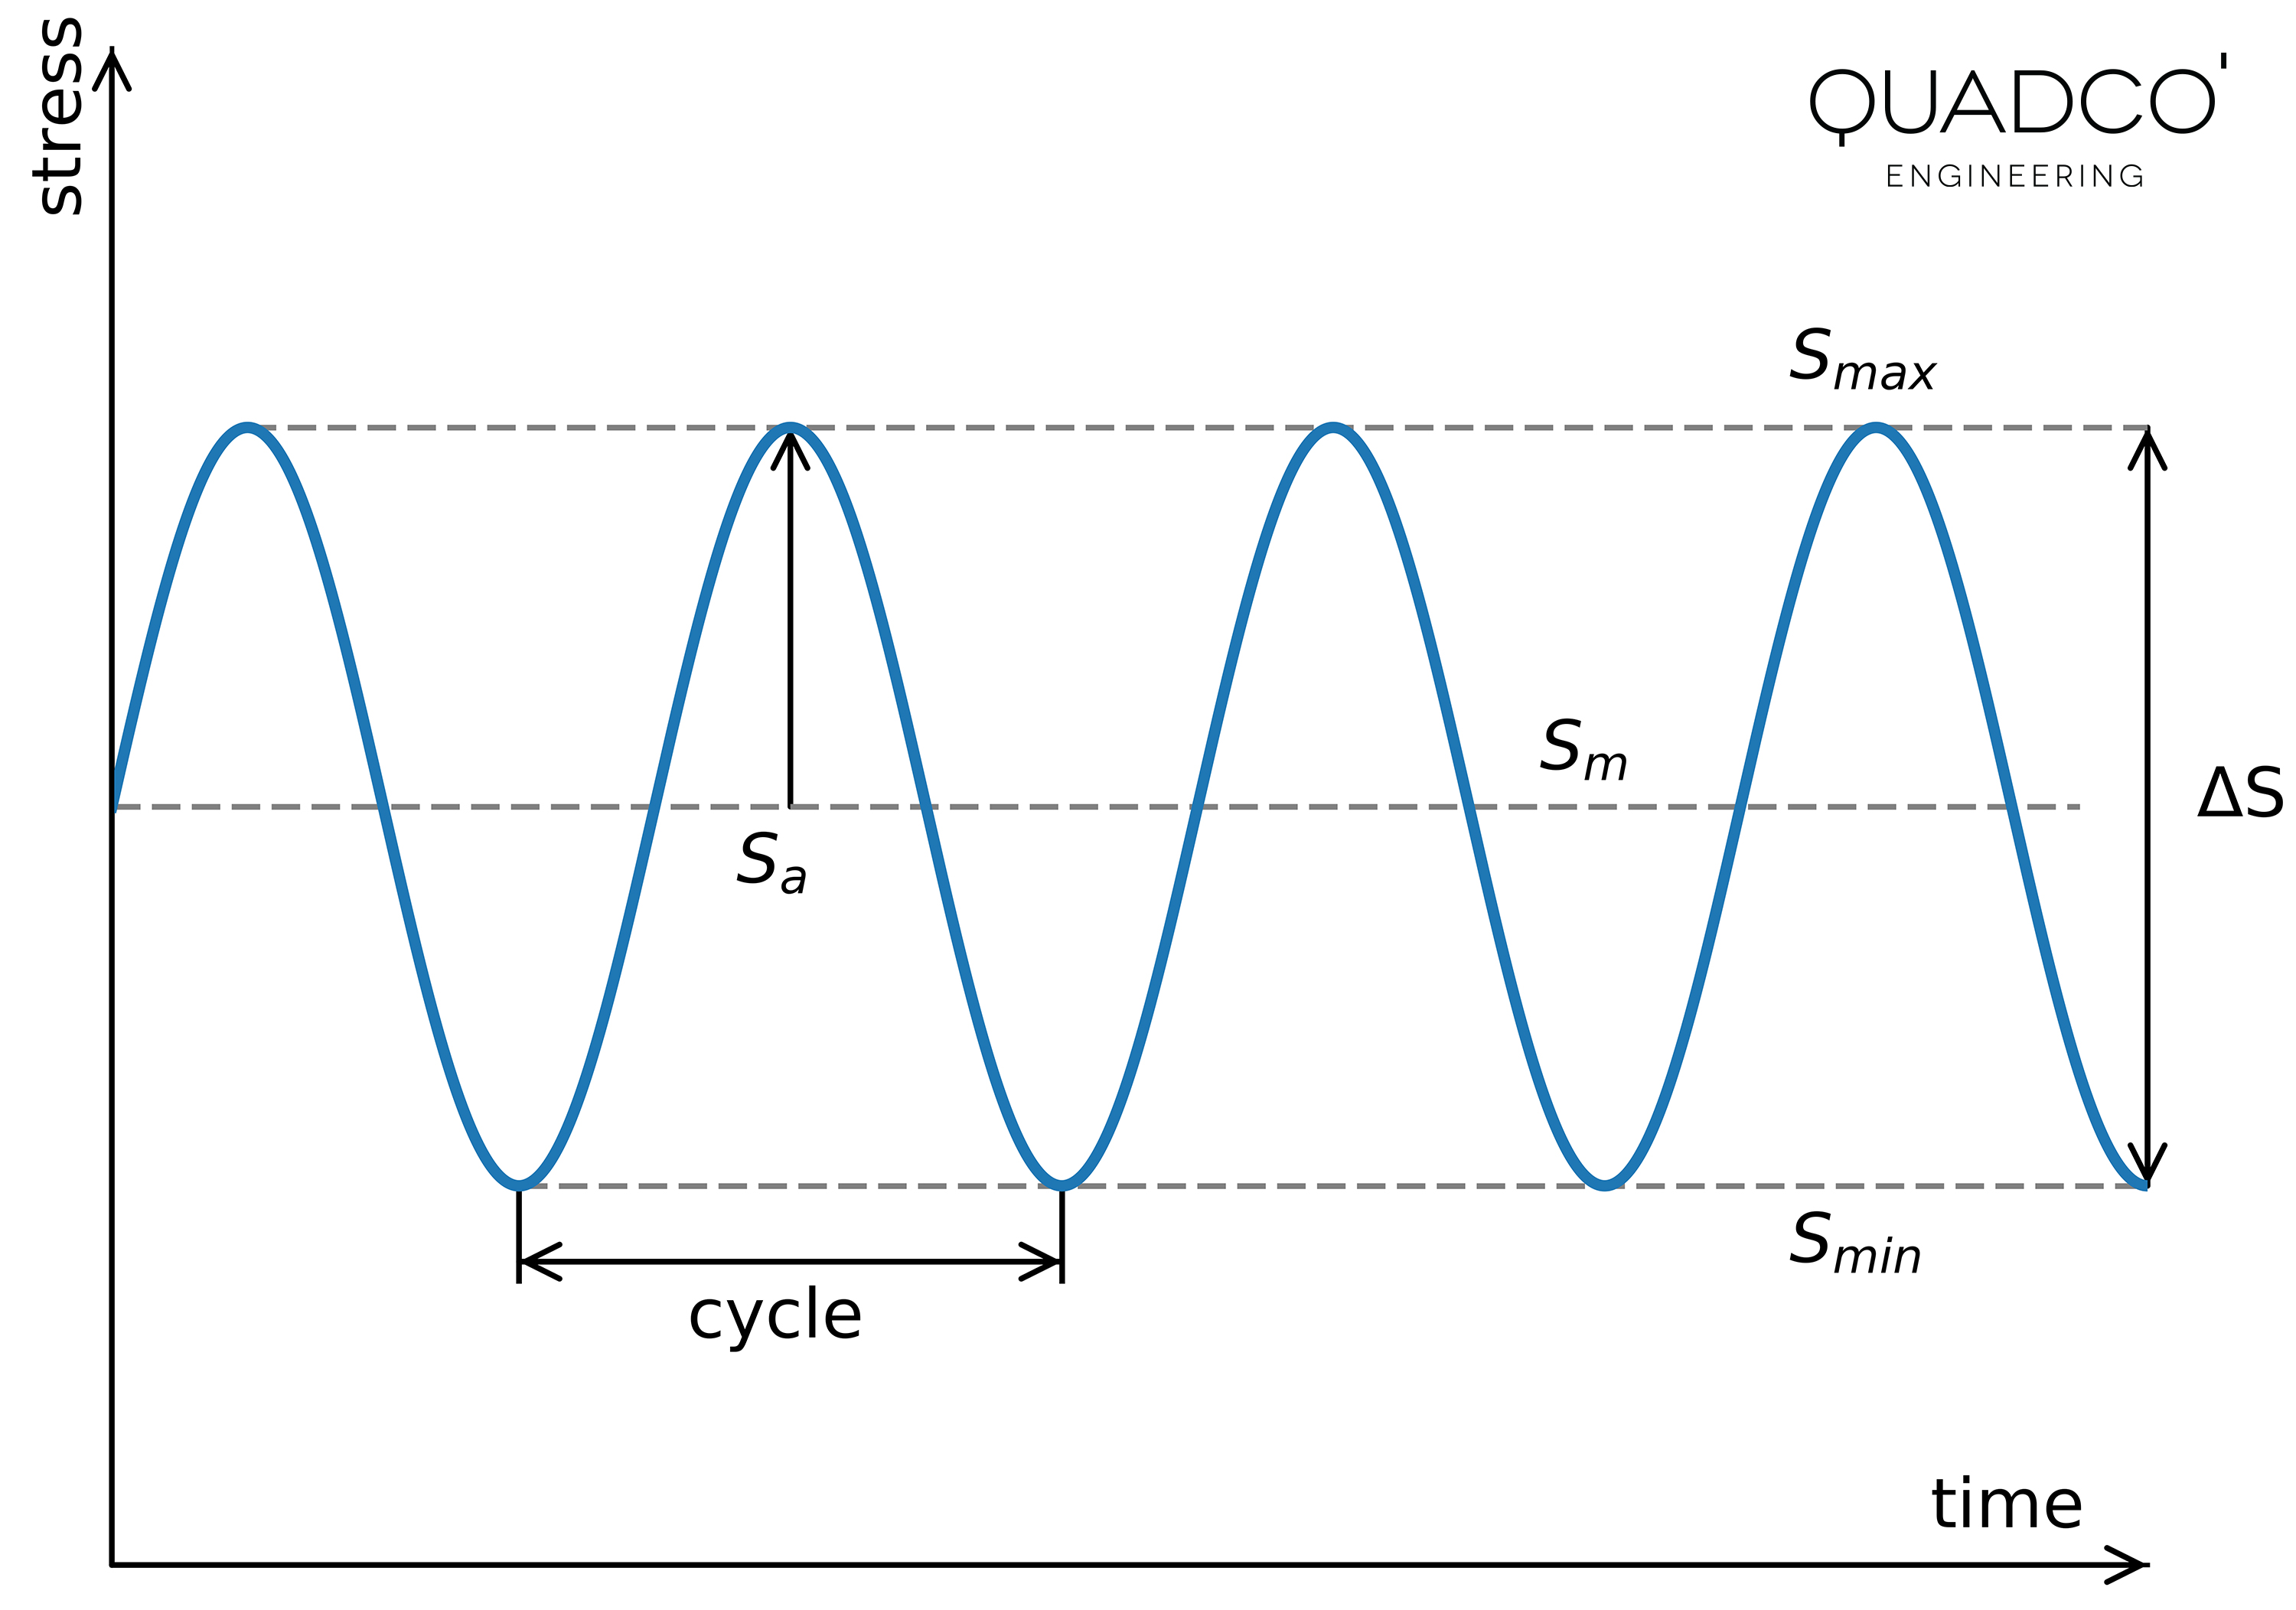
Alternating stress refers to the fluctuating stress experienced by a material as it undergoes cyclic loading. It is defined as the difference between the maximum and minimum stress values within one cycle of loading It is sometimes called the stress amplitude.
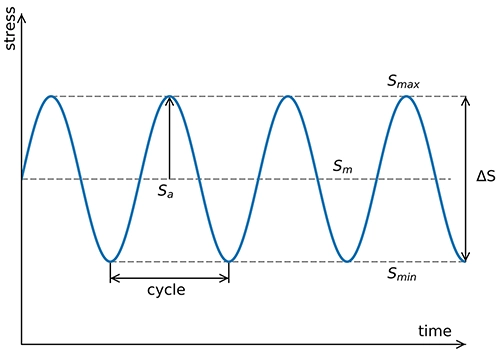
Fig. 1 Stress definitions: Sa, Smin, Smax, Sm en ΔS
- Cyclic stress-strain curve
-
The materials deformation during a fatigue test is measured in the form of a hysteresis loop. After some initial transient behavior the material stabilizes and the same hysteresis loop is obtained for every loading cycle. Each strain range tested will have a corresponding stress range that is measured. The cyclic stress strain curve is a plot of all of this data.
The curve describes the behavior of the material after it has been plastically deformed. This behavior is usually different than the initial behavior that is measured in a traditional tensile test. A simple power function is fit to this curve to obtain three material properties: cyclic strength coefficient K' cyclic strain hardening exponent n' and elastic modulus E.
- Dang Van criterium
-
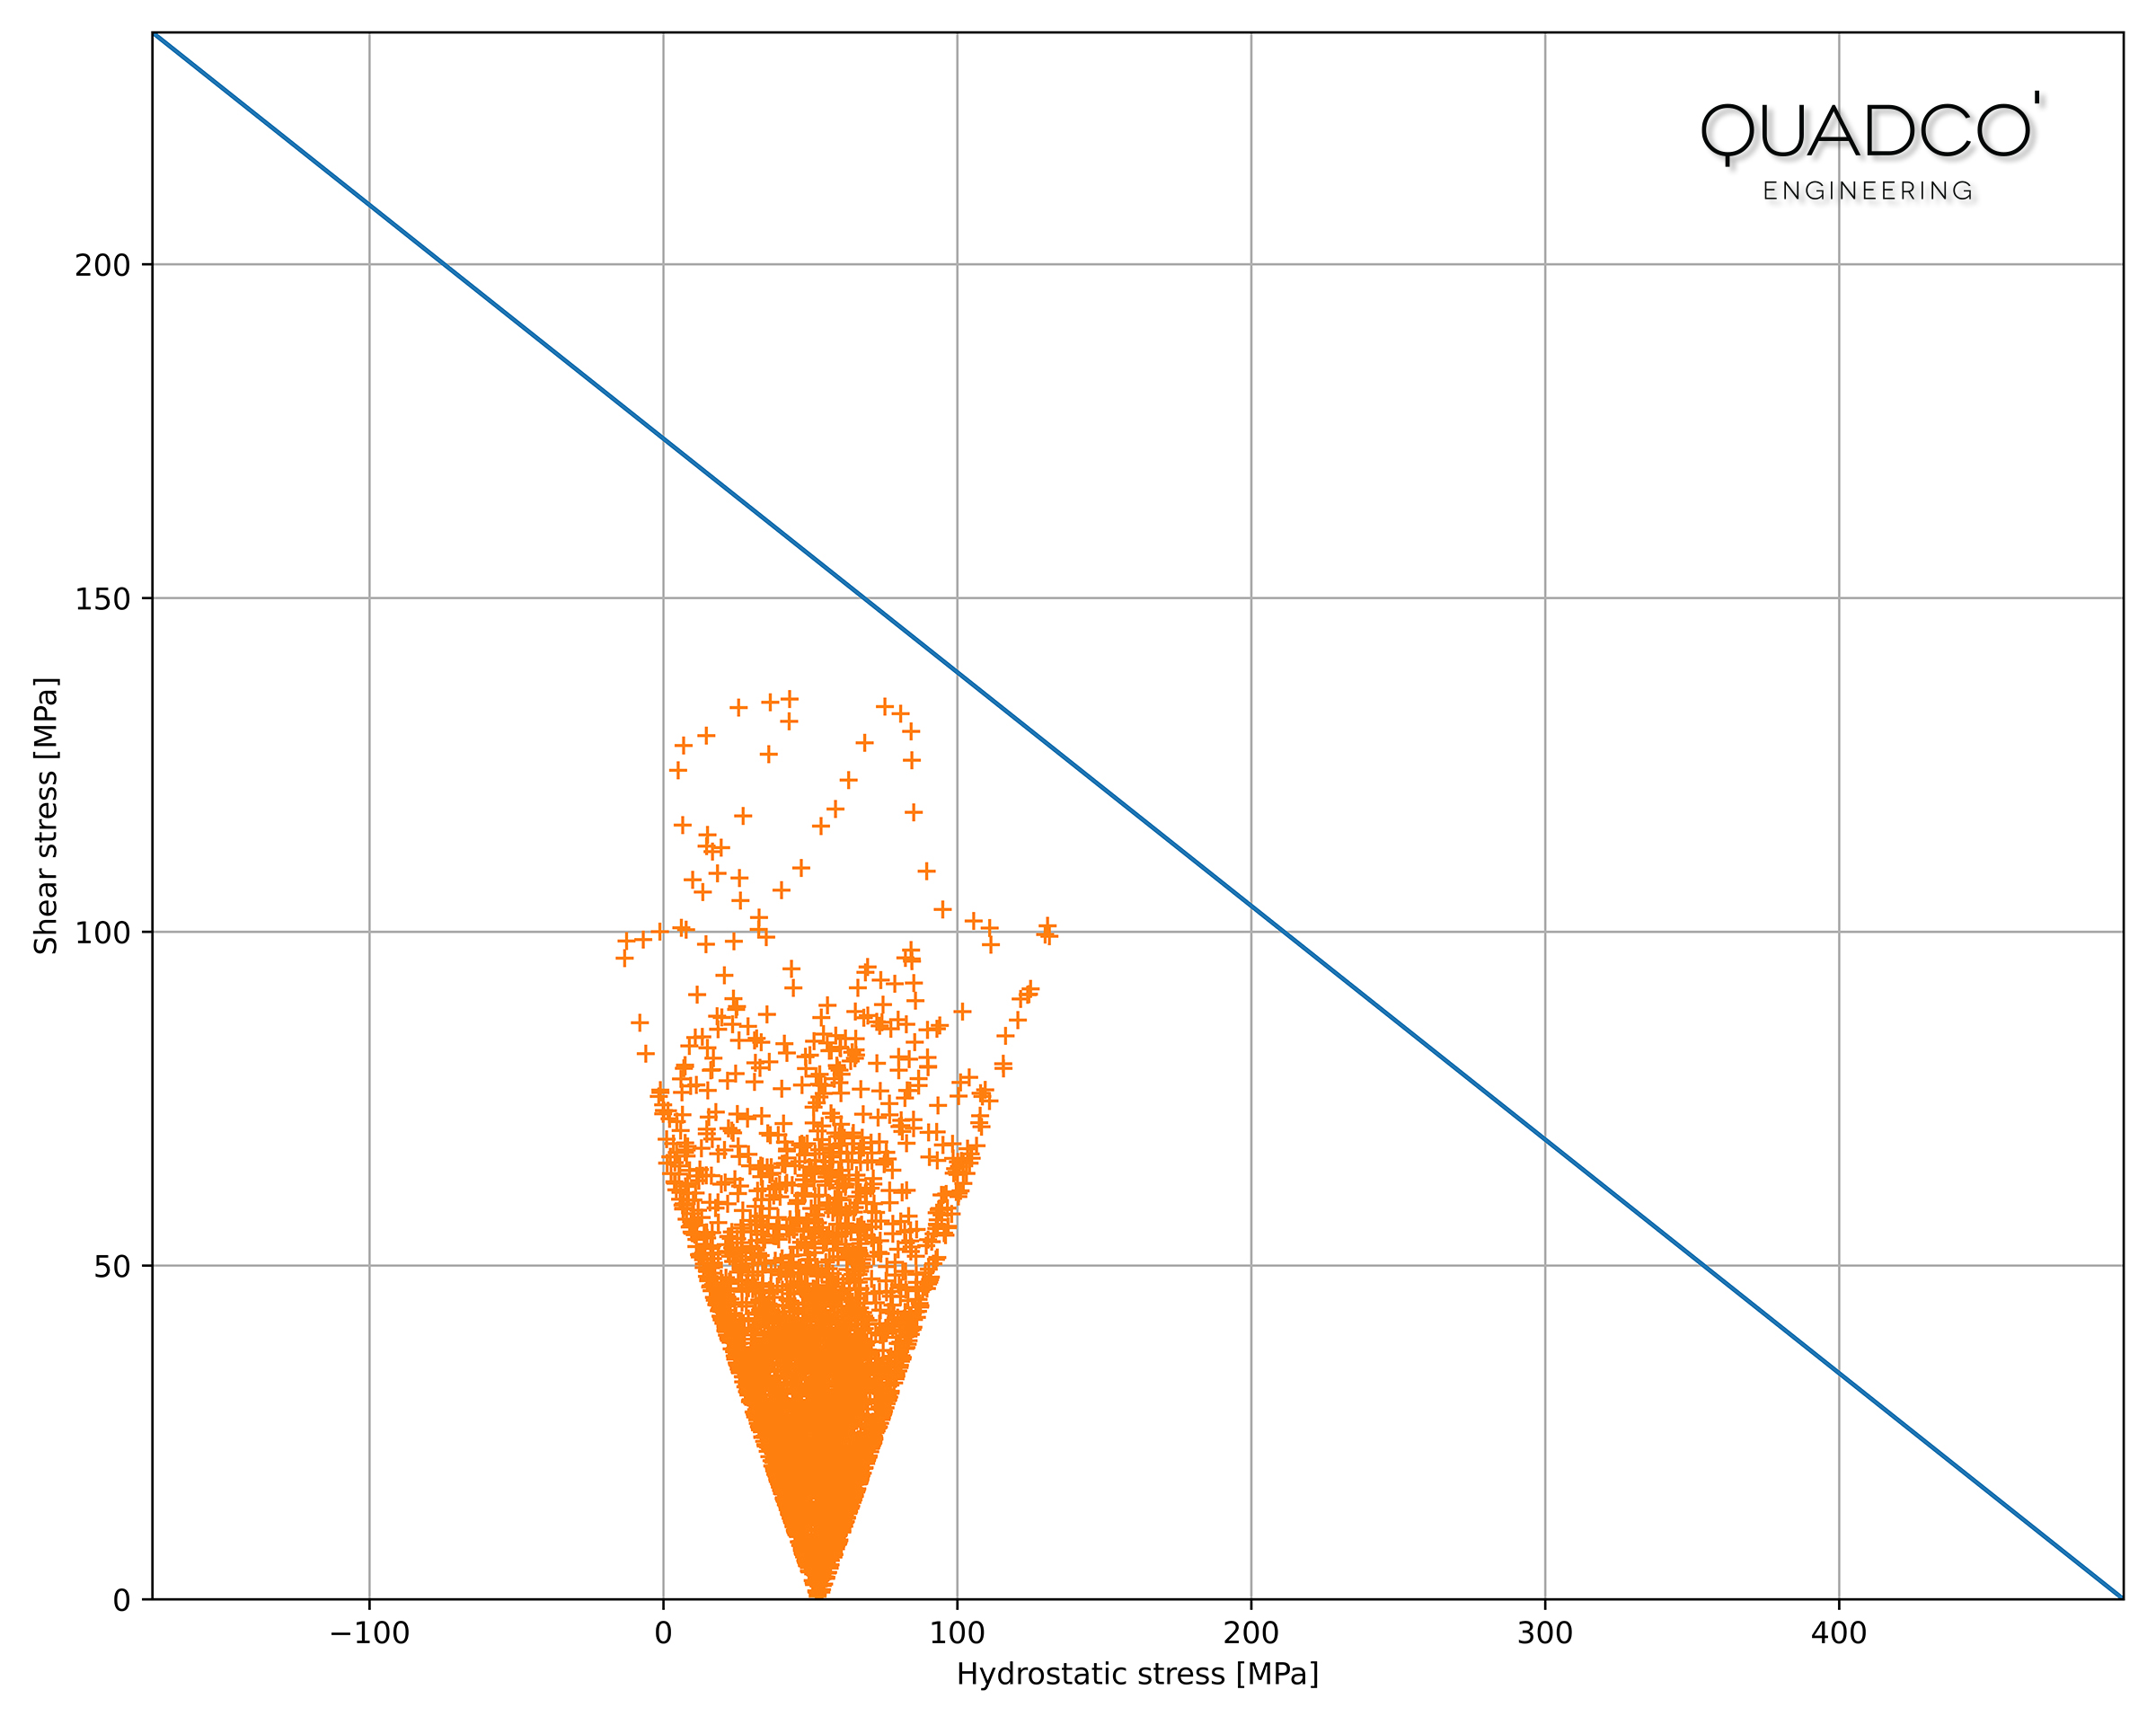
The Dang Van criterium is a fatigue limit criterion used to predict the endurance limit under complex, multiaxial loading situations. The output from the analysis is expressed as a safety factor and not a fatigue life. It uses specific material parameters calculated from tensile and torsion tests. Manufacturing effects can also be accounted for by using equivalent plastic strain in the unloaded component.
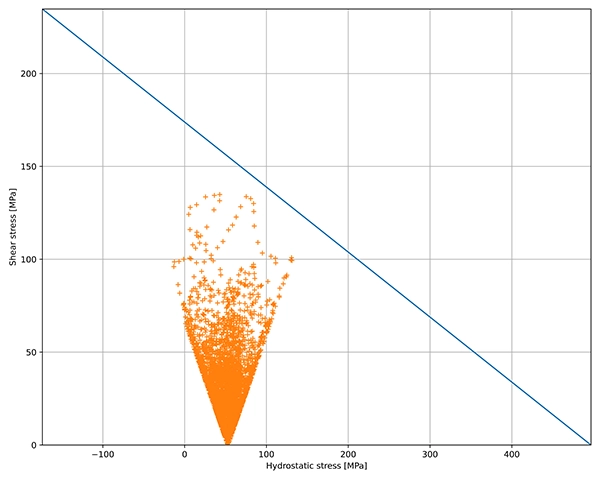
Fig. 2 The graph shows the Dang Van scatter plot (orange dots) at the critical element of the component. This plot represents how the loading path, in terms of microscopic shear stress and hydrostatic pressure, is located with regard to the fatigue threshold criterion (blue line). Basically, this means that if the scatter plot crosses the blue diagonal line, failure will occur.
- Damage tolerant design
-
This design against fatigue approach acknowledges that damage (like cracks) will occur during the lifetime of the component or structure. The design must tolerate the presence of damage without catastrophic failure, allowing for continued safe operation until the damage can be detected and repaired. This involves understanding the growth of damage over time, using non-destructive testing (NDT) methods to monitor for damage, and establishing inspection intervals based on how quickly damage can grow to a critical size. It's a proactive approach that aims to maintain safety and integrity even in the presence of unexpected damage.
See also infinite-life, safe-life and fail-safe design.
- Endurance limit
-
Steel specimens tested in the laboratory exhibit a safe stress below which failure will not occur. This safe stress is called the endurance limit or the fatigue limit. This behavior is only found in steel. In aluminum alloys, a fatigue strength at 107 cycles is usually used in place of the fatigue limit. This is a stress which will produce failures in 107 cycles.
- Fail-safe design
-
This design against fatigue approach is based on the assumption that some level of damage or failure is inevitable. The focus is on ensuring that such failure does not lead to catastrophic consequences. This is achieved by incorporating redundancy, designing components to fail in a non-catastrophic manner, or providing alternative load paths so that if one component fails, the overall structure can still carry the loads safely. This philosophy is common in systems where failure of a single component could lead to significant danger, such as in aircraft structures.
See also infinite-life, fail-safe and damage tolerant design.
- Fatigue limit
-
See Endurance limit
- Fatigue notch factor
-
Experiments have shown that the effect of small notches is less than that estimated from the traditional stress concentration factor Kt. The fatigue notch factor Kf can be thought of as the effective stress concentration in fatigue. It depends on the size of the stress concentration and the material. Small stress concentrations are more effective in high strength materials. This effect is dealt with using a notch sensitivity factor q:
$${\displaystyle {K _{f}} = 1 + ({{K _{t}} - 1})\cdot{q}}$$
The notch sensitivity factor q is an empirically determined constant that depends on the notch radius and material strength.
- Fatigue strength
-
The stress required to produce failures in a specified number of cycles. In steel this is usually 106 cycles and is 107 cycles for welds and aluminum alloys. It is directly related to the strength of the material.
A useful approximation for the fatigue strength is one half the ultimate strength.
- Goodman diagram
-
Tension mean stresses reduce the fatigue life from that observed with completely reversed loading. The Goodman diagram, originally proposed in 1890, is a graphical representation of this effect.
The alternating stress is plotted on one axis and the mean stress on the other. The allowable alternating stress with no mean stress is the fatigue limit. The maximum mean stress, with zero alternating stress, is the ultimate strength. A straight line is then drawn between the two points. Any combination of mean and alternating stress on this line will have the same fatigue life. Mathematically this may be expressed as:
$$\frac{S_a}{S_f} + \frac {S_m}{S_u} = 1$$
Sa is the alternating stress, Sf the fully reversed stress with zero mean, Sm the mean stress and Su the ultimate tensile stress.
- High-cycle fatigue
-
High-cycle fatigue is a type of fatigue failure that occurs in a material when it is subjected to a large number of loading cycles, typically more than 105 or even millions of cycles. High-cycle fatigue is characterized by relatively low-stress amplitudes and often involves smaller deformations compared to low-cycle fatigue.
- Hysteresis loop
-
The stress-strain response of a material that is cyclically loaded is in the form of a hysteresis loop.
The hysteresis loop is often characterized by its stress range Δσ and strain range Δε. The strain-range is often broken up into the elastic part and the plastic part.
- Infinite-life design
-
This design against fatigue approach aims for the component or structure to withstand an infinite number of load cycles without failure, assuming the loads do not exceed a certain threshold, being the endurance limit. If the stresses applied are kept below this level, theoretically, the component should never fail due to fatigue. This approach is often used in critical components where failure is not an option, but it may lead to excessive component weight and increased costs.
See also safe-life, fail-safe and damage tolerant design.
- Loading factor
-
Historically, fatigue limits have been determined from simple bending tests where there is a stress gradient in the test specimen. A specimen loaded in tension will have a lower fatigue limit than one loaded in bending. An empirical correction factor, called the loading factor, is used to make an allowance for this effect.
- Low-cycle fatigue
-
Low-cycle fatigue is a type of fatigue failure that occurs in materials when they are subjected to high-stress amplitudes and undergo significant plastic deformation over a relatively small number of loading cycles, typically less than 104–105 cycles. See also high-cycle fatigue
- Mean stress
-
The mean stress Sm is the average value of the stresses.
- Neuber's rule
-
Neuber's rule is used to convert an elastically computed stress or strain into the real stress or strain when plastic deformation occurs. For example, we may compute a stress with elastic assumptions at a notch to be KtS and this stress exceeds the strength of the material. The real stress will be somewhere on the materials stress-strain curve at some point σ.
Neuber's rule states that the product of the elastic stress and strain solution is equal to the product of the real elastic plastic solution. Mathematically this is expressed as:
$${\displaystyle {K _{t}}{S}\cdot{K _{t}}{e}={\sigma}\cdot{\varepsilon}}$$
- Nominal strain
-
The nominal strain is the strain away from any local stress concentrations.
- Nominal stress
-
The nominal stress is the stress away from any local stress concentrations.
- Redundancy
-
In the context of structural engineering, redundancy refers to the design principle where a structure is built with additional elements or alternate load paths that are not strictly necessary for the structure to withstand its intended loads under normal conditions. This design approach enhances the structure's ability to continue performing its intended function in the event of failure of one or more structural components. Redundancy in structures is a critical aspect of ensuring safety and reliability, particularly in environments where the failure of a single element could lead to catastrophic consequences.
See also fail-safe design.
- Safe-life design
-
The safe-life design refers to a design approach where components are designed to have a finite operational life under specific loads or stresses. This approach is often used in various industries such as automotive, pressure vessel, and jet engine design. The safe-life design includes a margin for the scatter of fatigue results and other unknown factors, and the calculations may be based on stress-life, strain-life, or crack growth relations. Field and simulated testing play a key role in determining safe life for products such as jet engines, gun tubes, and bearings.
See also infinite-life, fail-safe and damage tolerant design.
- Safety factor
-
The safety factor is how much you want to underestimate the maximum strength of the materials in order to ensure a safe design. A single safety factor is applied to both the stress amplitude and the mean stress.
This can be graphically shown in the Goodman Diagram.
- Size factor
-
Experimentally, larger parts have lower fatigue limits than smaller parts. Since the materials data is obtained from small specimens, a correction factor, called the size factor, is used for larger diameters. For non-circular sections an effective diameter is computed. The effective diameter is obtained by equating the volume of material subjected to 95% of the maximum stress to a round bar in bending with the same highly stressed volume.
- Strain amplitude
-
The strain amplitude is one half the strain range.
- Strain-life curve
-
The strain-life curve, also known as the εε-N curve, is a fundamental concept in the field of material fatigue analysis, offering a method to predict the fatigue life of materials under cyclic loading based on their strain response. The strain-life approach combines both elastic and plastic strain components to assess the durability of materials over a wide range of loading cycles. This method is particularly useful for low-cycle fatigue scenarios where significant plastic deformation occurs.
The strain-life curve is represented by two main relationships: Basquin's equation for the elastic strain component and the Manson-Coffin relationship for the plastic strain component. Basquin's equation, proposed in 1910, relates the elastic strain amplitude to the fatigue life, while the Manson-Coffin relationship, developed in the early 1960s, establishes a correlation between plastic strain amplitude and fatigue life. These equations together describe how materials respond to cyclic stresses and strains, enabling the estimation of fatigue life from a combination of elastic and plastic strain components.
- Strain range
-
The strain range Δε is the maximum strain minus the minimum strain in a cycle.
- Stress amplitude
-
The stress amplitude Sa is the amount the stress deviates from the mean. It is sometimes called the alternating stress.
- Stress concentration factor
-
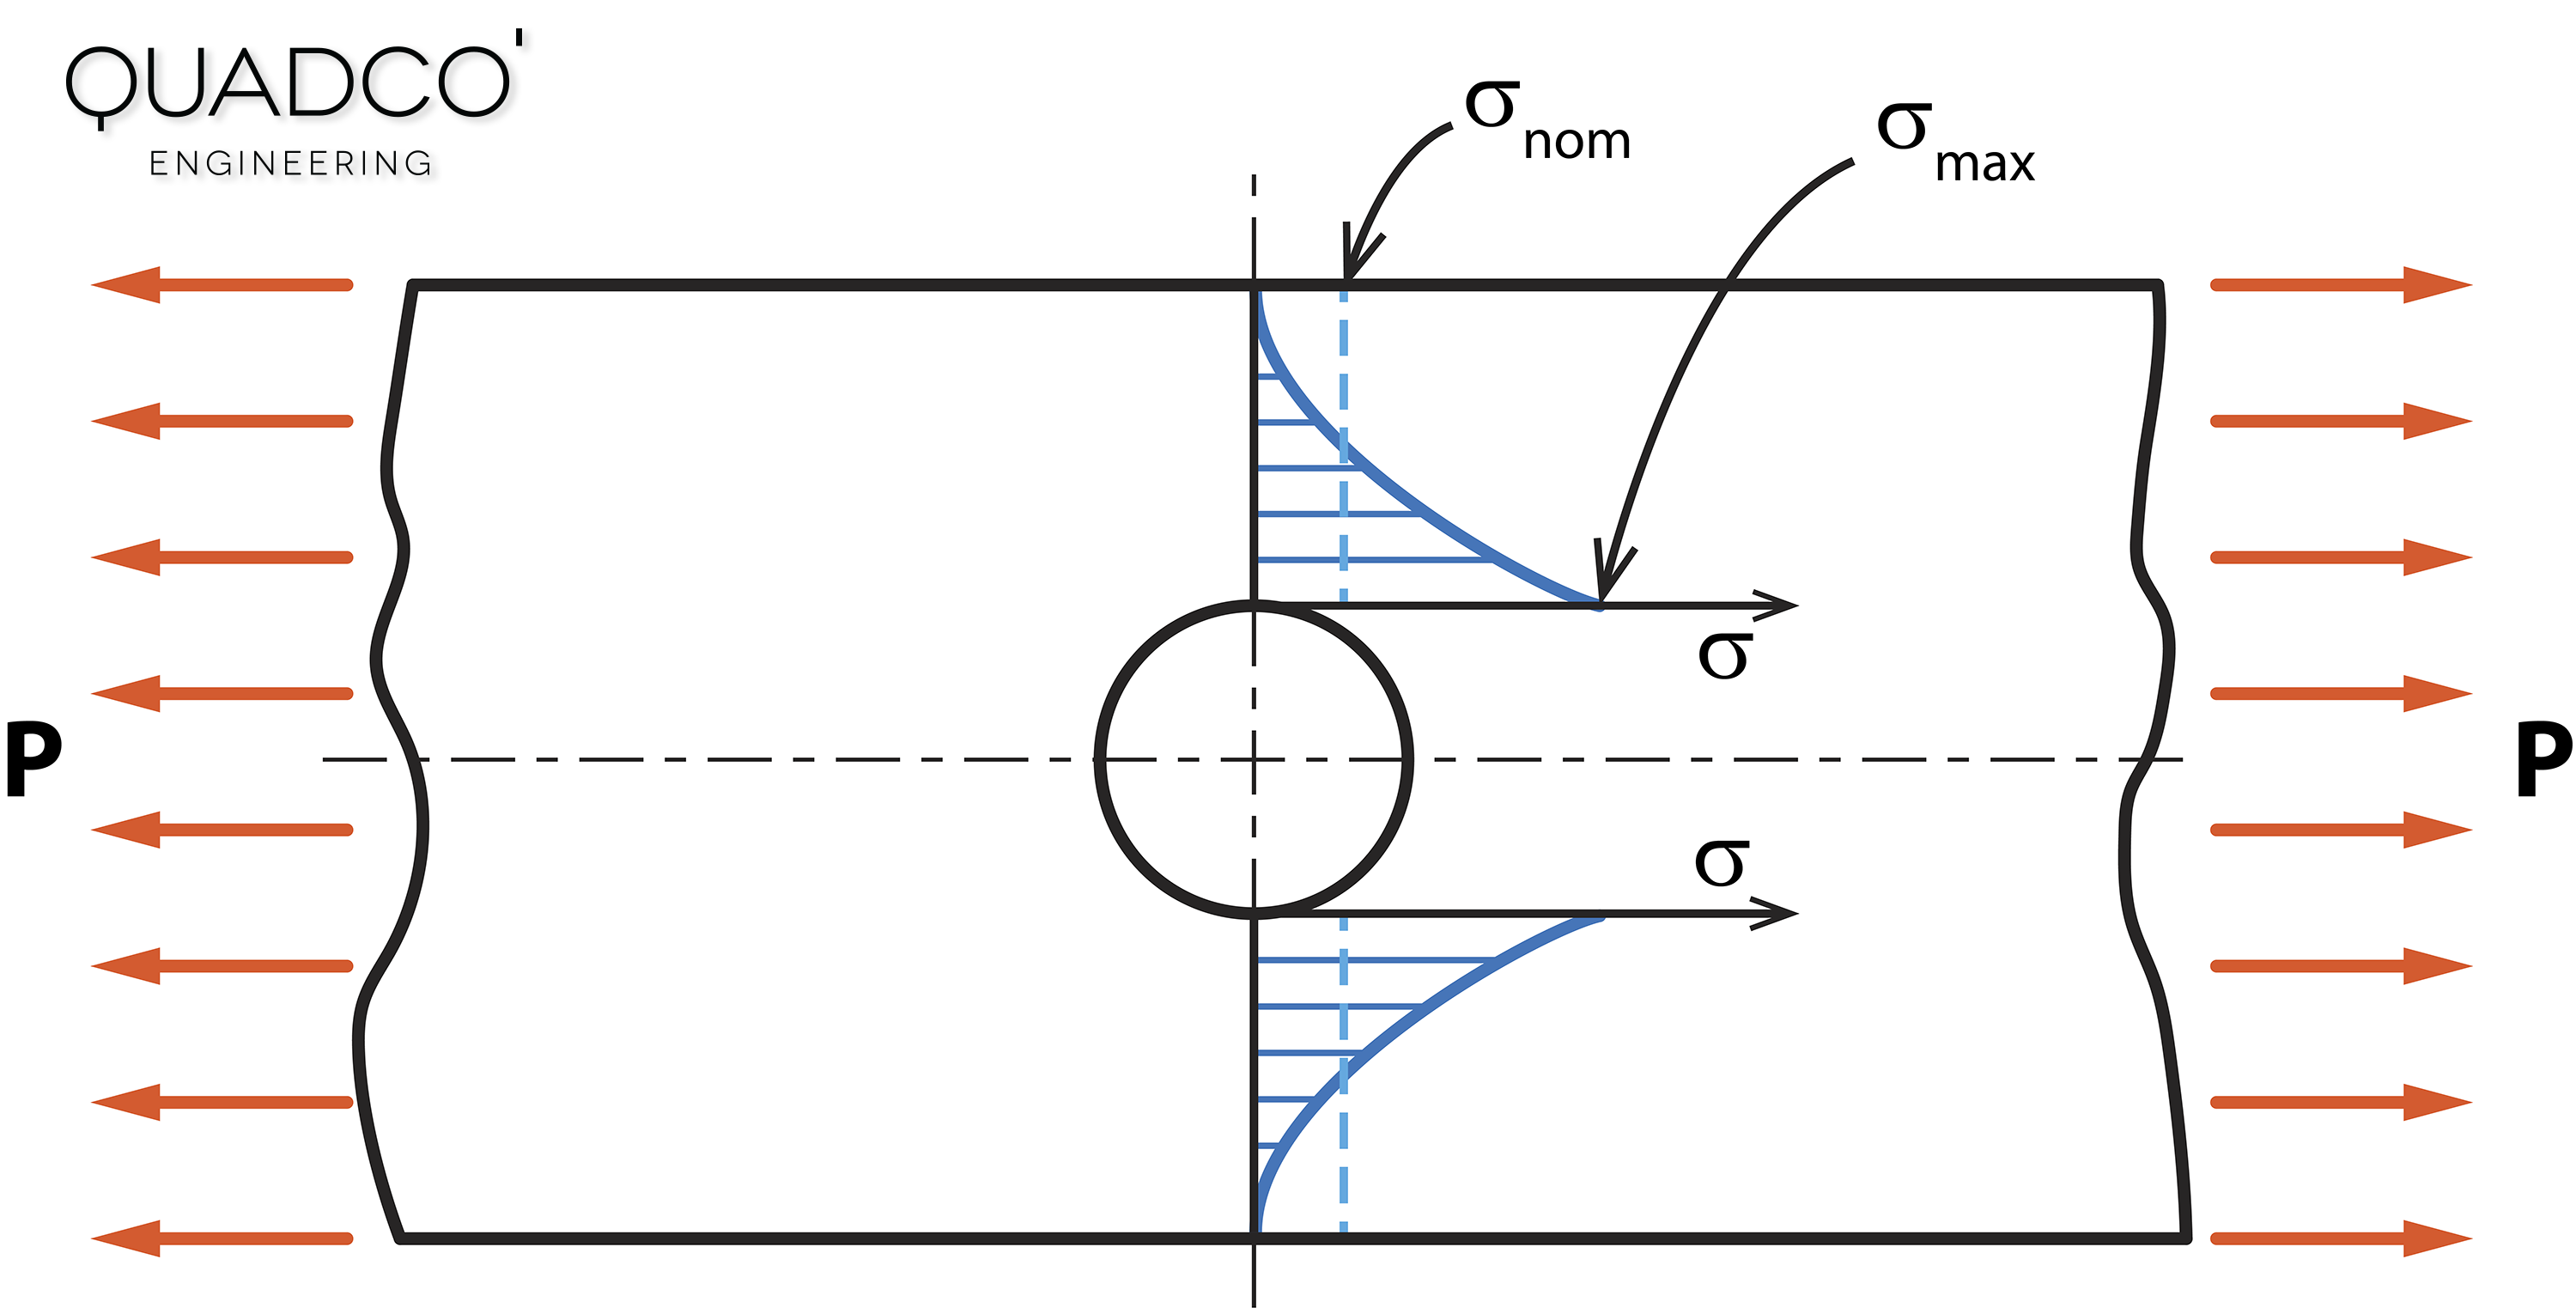
Stress concentrations arise from any abrupt change in the geometry of a part under load. As a result, the stress distribution is not uniform throughout the cross-section.
For example, it is often necessary to drill a hole in a plate. When a load P is applied, the presence of the hole disturbs the uniform nominal stress in the plate.
The profile of the stress in the cross-section through the center of the hole has the form shown in the figure below (blue color). Notice that the maximum stress σmax is Kt · σnom and occurs at the edge of the hole. The factor Kt is known as the stress concentration factor.
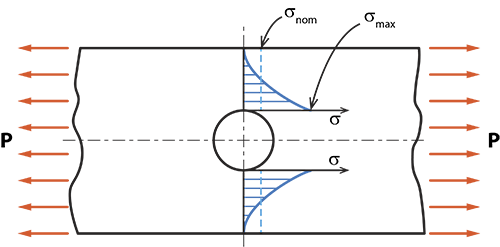
Fig. 3 Stress concentration around a hole in a plate
- Stress-life curve
-
The stress-life (S-N) curve, also known as the Wöhler curve, is a graphical representation of the relationship between the applied stress level and the fatigue life of a material. It is a fundamental tool in fatigue analysis and design. The S-N curve illustrates the stress level (S) required to cause failure in a specified number of cycles (Nf).
The S-N curve typically shows a continuously sloping curve, with less variability in life at shorter lives and greater variability at longer lives. This variability can range from less than a factor of 2 to more than one or two orders of magnitude.
In some materials, a discontinuity or "knee" in the S-N curve may be observed between 106 and 107 cycles under noncorrosive conditions. However, most materials do not exhibit this knee, and in corrosive environments, all S-N data invariably have a continuously sloping curve.
- Stress range
-
The stress range ΔS is the peak to peak stress.
- Surface finish factor
-
Fatigue limits are determined from small polished laboratory specimens. A surface finish correction is made to the fatigue limit of the material to obtain an estimate of the fatigue limit of the part in the condition it is actually being used.
For more information about the effect of the surface quality on the fatigue life, see surface roughness factor KR.
- Ultimate strength
-
The ultimate strength Su is also called the tensile strength. It is the maximum stress reached in an engineering stress strain diagram.
Our courses
If you want to learn more about how to use the Finite Element Method more efficiently in your designs, then you might want to take a look at our course Practical Introduction to the Finite Element Method or our course Introduction to Fatigue Analysis with FEA.