The Challenge
A flue gas duct in an energy plant directs hot flue gas downward through a vertical column containing three heat exchangers. The gas enters horizontally and is redirected downward through a sharp 90-degree bend before passing over the heat exchanger tube bundles. In the original design, the abrupt change in flow direction caused a highly uneven velocity distribution at the inlet of the first heat exchanger, severely reducing its thermal efficiency.
The operator needed to understand the root cause of this uneven distribution and evaluate whether installing guide vanes in the bend section could improve flow uniformity — and if so, which vane configuration would deliver the best performance. The goal was to maximise heat exchanger utilisation without increasing the system's overall pressure drop beyond acceptable limits.
Our Approach
We built a 3D CFD model of the flue gas duct in Ansys Fluent, using half-symmetry to reduce computational cost while retaining full accuracy. The three heat exchangers were modelled as porous media zones with velocity-dependent pressure drop characteristics derived from the VDI Heat Atlas. A mass flow inlet boundary of 41.8 kg/s and a flue gas density of 0.869 kg/m³ defined the operating conditions. The flow domain was discretised with poly-hexcore elements for an optimal balance between mesh quality and computational efficiency.
Systematic variant study
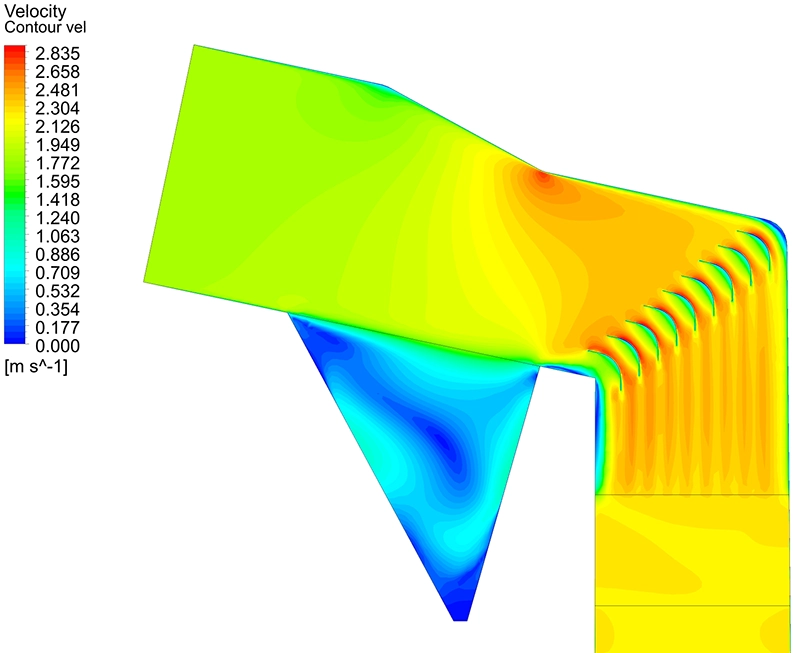
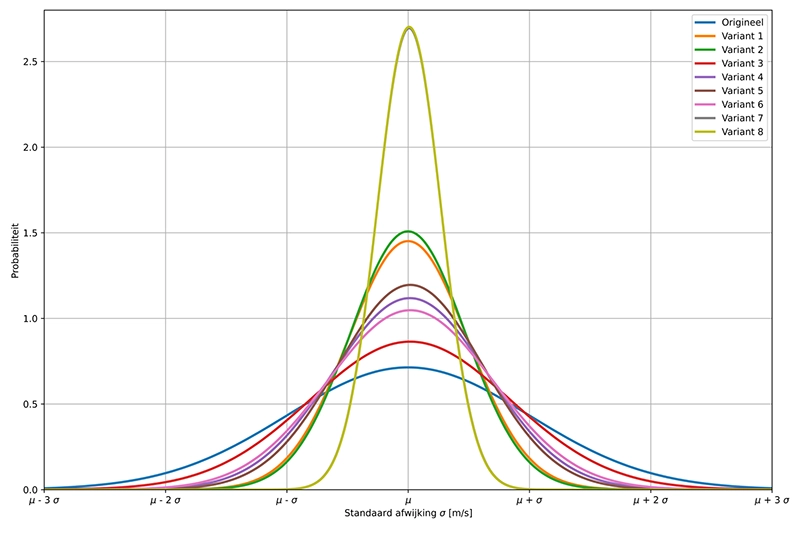
In addition to the original geometry, we analysed eight guide vane configurations with varying numbers, sizes, positions and shapes. These ranged from four large turning vanes in the bend to ten small-radius vanes with straight extensions upstream and downstream. Each variant was assessed both qualitatively — using velocity contour plots, static pressure fields, vector plots and streamlines — and quantitatively by computing the standard deviation of the vertical velocity component at the inlet plane of the first heat exchanger.
Root cause identification
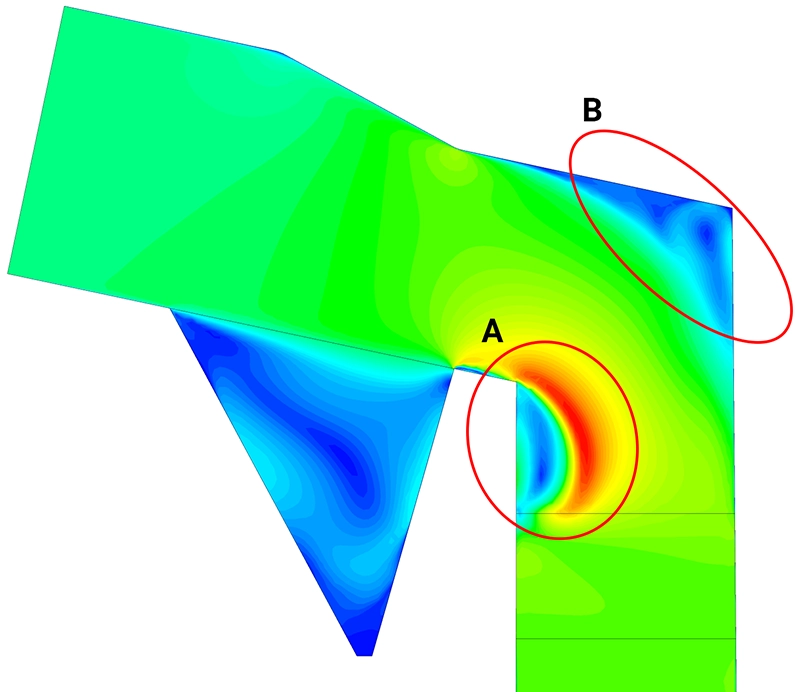
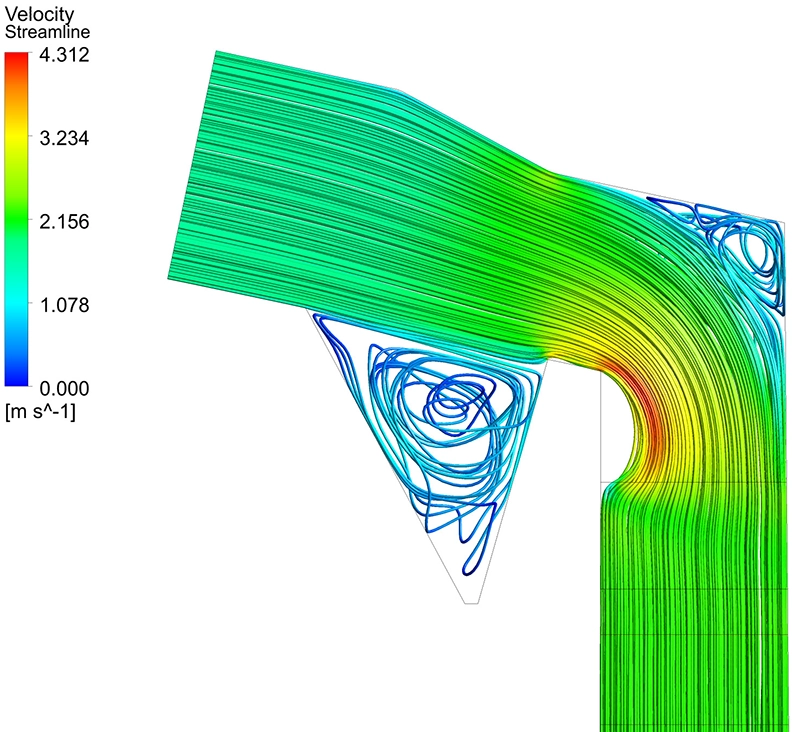
The CFD results for the original model revealed two distinct recirculation zones: one at the inner corner of the bend where the flow separates, and a second at the outer wall of the vertical column where the high-momentum gas impinges and reverses. These two zones are the primary cause of the non-uniform velocity profile entering the first heat exchanger.
Results
The quantitative comparison across all nine models yielded a clear ranking. Configurations with large guide vanes (variants 1 and 2, with four and five vanes respectively) halved the velocity spread at the first heat exchanger inlet compared to the original design, reducing the standard deviation by a factor of approximately 2.
The best-performing configurations were variants 7 and 8, both featuring small-radius turning vanes with 200 mm straight extensions on both the upstream and downstream sides. These designs achieved a standard deviation reduction by a factor of 3.8 compared to the original model — a near-fourfold improvement in flow uniformity. Variant 8, with ten small vanes (including one placed against the upper wall to shield the outer corner), delivered the lowest standard deviation of 0.148, down from 0.559 in the original design.
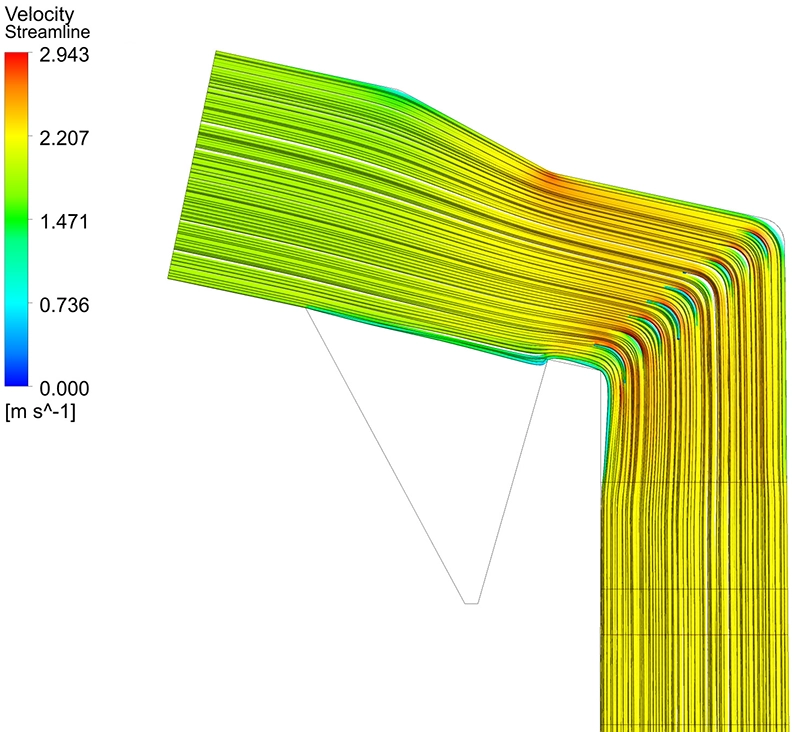
The streamline visualisations confirmed that the small-radius vanes with straight extensions effectively eliminate both recirculation zones, guiding the flow smoothly through the bend and distributing it evenly across the full width of the heat exchanger. The intermediate variants (3 through 6) showed progressive improvements but could not match the performance of the small-vane configurations, demonstrating that vane count, radius and the addition of straight inlet/outlet extensions are all critical parameters.
Value Delivered
This CFD study combined with a systematic optimisation approach gave the operator a clear, evidence-based recommendation for the guide vane configuration. Rather than relying on engineering rules of thumb or a single assumed design, the parametric study explored a wide design space and identified the governing parameters for flow uniformity.
By selecting the optimal vane configuration, the operator can expect substantially improved heat transfer performance from the first heat exchanger, reduced thermal gradients and associated fatigue risk in the tube bundles, and a lower likelihood of local fouling caused by low-velocity zones. The detailed CFD results — including contour plots, vector fields, streamlines and quantitative metrics — were delivered in a comprehensive report that serves as both an engineering decision document and input for the detailed mechanical design of the vanes.
Dealing with uneven flow distribution or duct design challenges?
Whether you need to optimise guide vanes, improve heat exchanger performance or analyse flow patterns in ducts and channels, our CFD expertise can help. Get in touch for a free initial consultation.
Contact us or call us at +32 478 618 118