Fatigue & Durability Analysis
A structure that passes a static strength calculation can still fail in service — not from a single overload, but from thousands or millions of smaller load cycles that progressively damage the material. Fatigue is the leading cause of mechanical failure in engineering structures, yet it is often the least understood. We predict where cracks will initiate, how long your design will last under real-world loading, and what you can change to extend its service life — before a single prototype is built.
Problems we solve
Our clients come to us when they need to understand how long a structure will last, why a component is cracking in the field, or how to design for durability from the start. Typical projects include:
- Predicting fatigue life of a new design — determine the expected service life under realistic loading before committing to production.
- Investigating field failures — identify the root cause of cracks that appear during operation and recommend targeted design changes to prevent recurrence.
- Assessing welds and joints — evaluate seam welds, spot welds and bolted connections, which are often the weakest link in a fatigue-loaded structure.
- Extending the life of existing structures — determine remaining useful life after years of service, supporting decisions on continued operation, repair or replacement.
- Qualifying designs against durability standards — demonstrate compliance with industry-specific fatigue requirements such as IIW, DNV, Eurocode 3 or FKM.
- Optimising for weight and durability — find the lightest design that still meets your fatigue life target, avoiding both under-design and unnecessary over-engineering.
How we assess fatigue life
Fatigue analysis requires a combination of accurate stress or strain results from Finite Element Analysis, representative load histories and reliable material data. We select the right method based on the nature of your problem, the available data and the applicable standards.
High-cycle fatigue (stress-life / S-N)
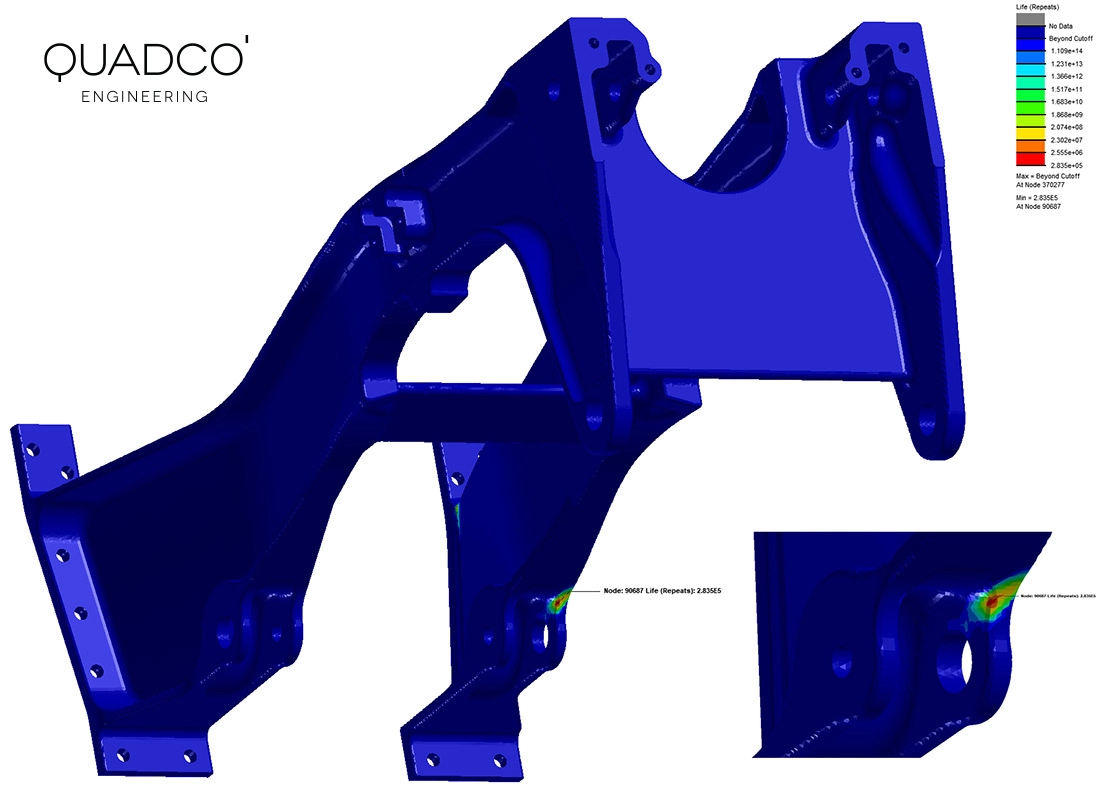
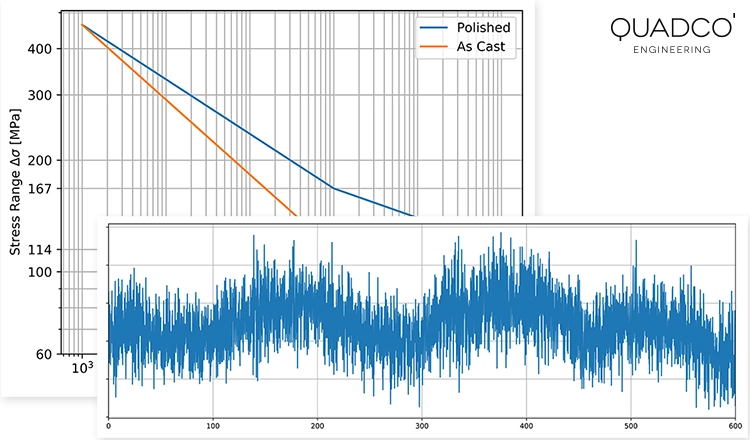
The stress-life method is the most widely used approach for components that experience a large number of relatively low-stress cycles — typically above 10 000 cycles. We apply S-N curves with appropriate mean stress corrections (Goodman, Gerber, FKM), surface finish factors and size effects to predict the fatigue life at every location in your structure. This method is the standard for most machine components, vehicle structures and welded steel constructions.
Low-cycle fatigue (strain-life / E-N)
When loads are high enough to cause local plastic deformation at notches or stress concentrations, the strain-life method provides more accurate results. We use the E-N approach with Neuber or Seeger-Beste plasticity corrections for components in the low-cycle regime — typically below 10 000 cycles. This is critical for engine parts, pressure vessels under cyclic loading and structures subject to occasional overloads.
Crack growth analysis
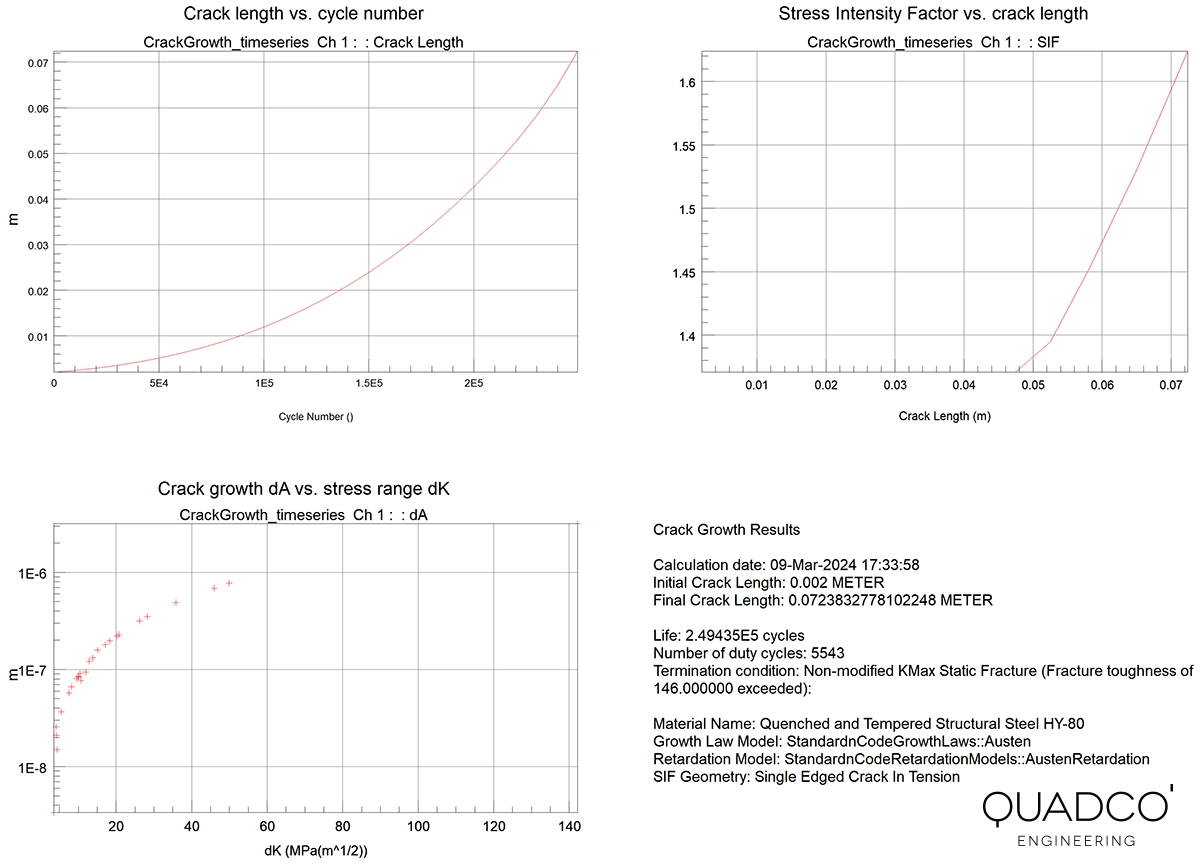
Once a fatigue crack has initiated — or when a pre-existing defect is already present — fracture mechanics tells you how fast the crack will grow and when it will reach a critical length. Some materials exhibit significant crack growth resistance, meaning the remaining life after crack initiation can be substantial. We apply Paris-law based crack growth calculations and can account for variable-amplitude loading, stress intensity thresholds and crack closure effects.
Specialised fatigue capabilities
Weld fatigue assessment
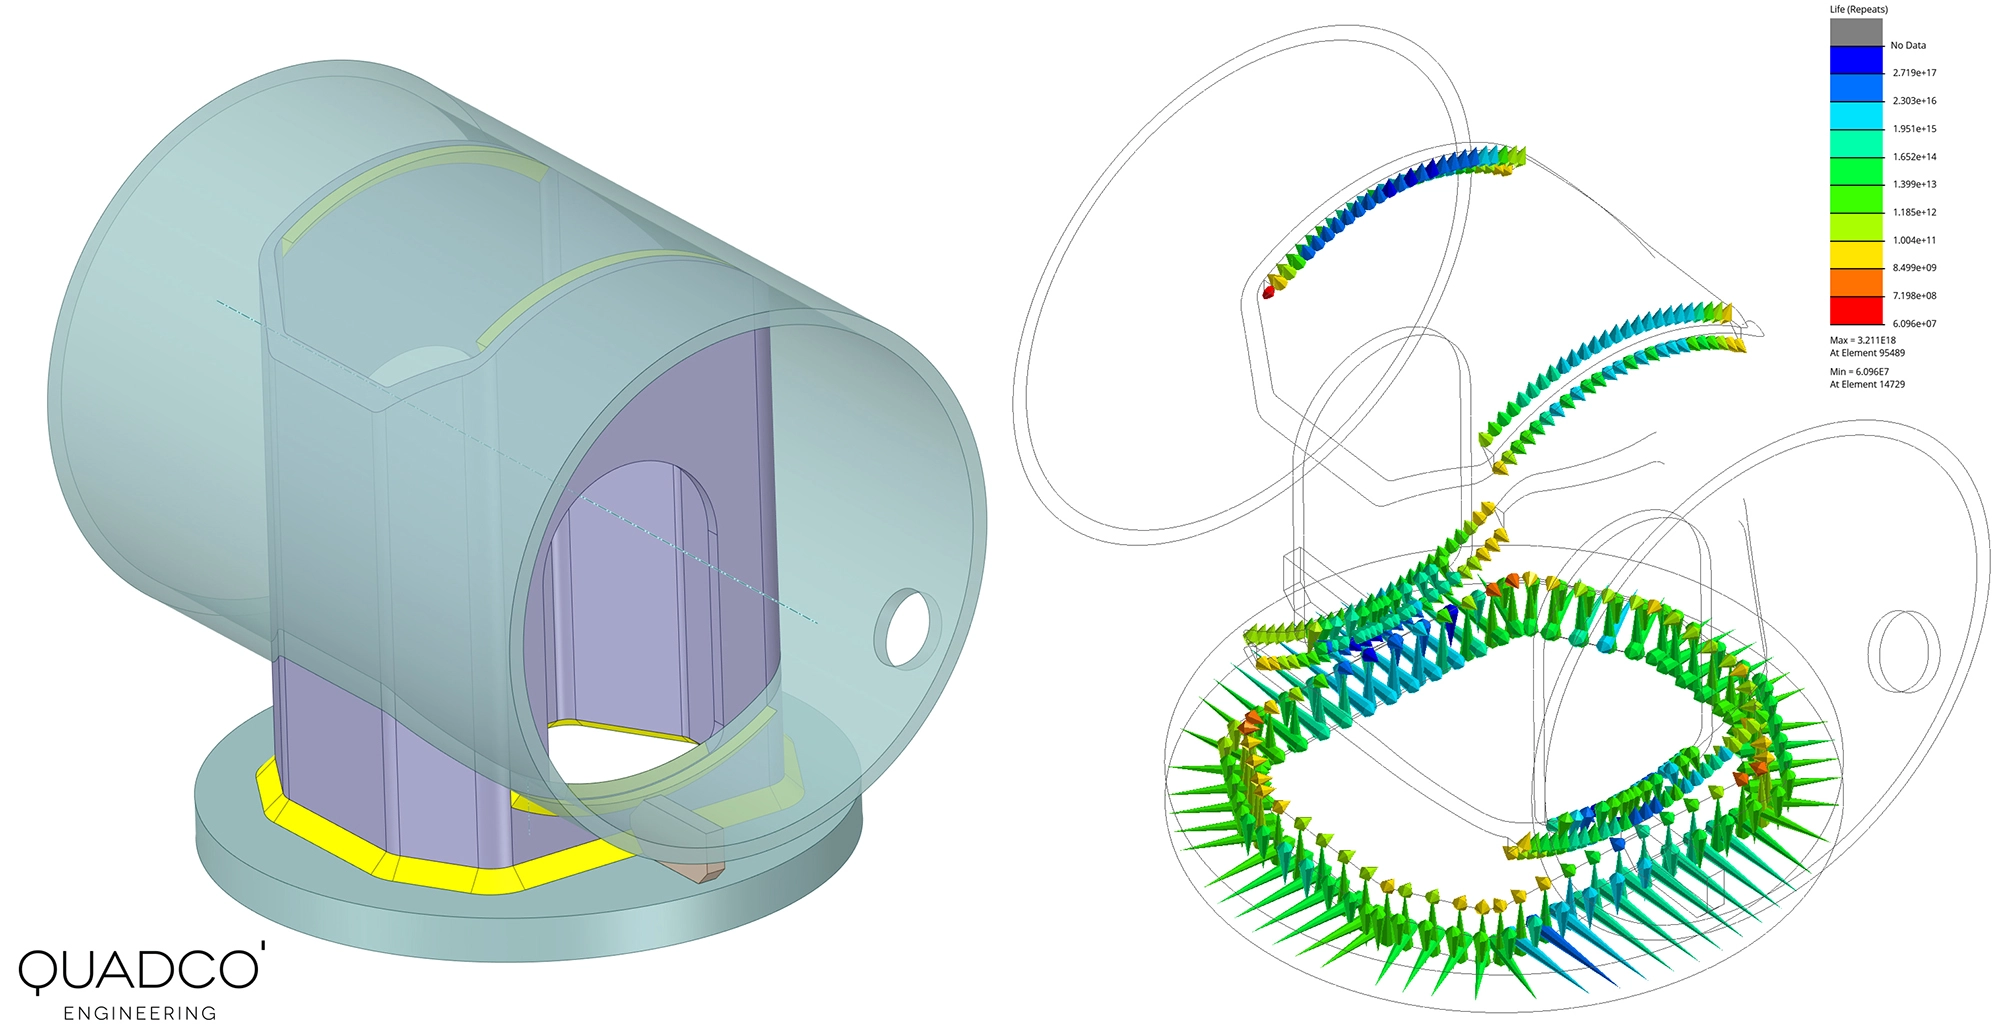
Welds are often the fatigue-critical locations in a structure. The local geometry of the weld toe and weld root, residual stresses from the welding process and microstructural changes in the heat-affected zone all reduce the fatigue resistance compared to the base material. We assess seam welds and spot welds using structural stress (hot-spot) methods, effective notch stress methods and nominal stress approaches in accordance with IIW, DNV, Eurocode 3 and other standards.
Vibration fatigue
Structures excited by random or broadband loads — such as wind, waves, road roughness or machine vibration — require a frequency-domain approach to fatigue assessment. We perform vibration fatigue analyses using power spectral density (PSD) inputs and frequency-response FEA results, which is far more efficient and often more realistic than attempting to run equivalent time-domain simulations. This approach is particularly valuable for offshore structures, electronic assemblies and vehicle components.
Thermo-mechanical fatigue
Components that experience combined thermal cycling and mechanical loading — such as combustion engine parts, exhaust manifolds, turbine blades and fired pressure vessels — are subject to thermo-mechanical fatigue (TMF). The interaction between thermal expansion, creep and mechanical loading creates failure modes that standard isothermal fatigue methods cannot capture. We combine thermal analysis with advanced fatigue models to predict TMF life under realistic operating conditions.
Fatigue of composite materials
Composites fail differently from metals: damage develops as matrix cracking, delamination and fibre breakage rather than a single growing crack. We assess the fatigue durability of composite laminates using stress-life methods with anisotropic failure criteria (Hashin-Rotem, Norris, and others), accounting for the directional properties and layup of the material. This is particularly relevant for aerospace, automotive and wind energy applications where composites are increasingly replacing metal structures.
Multi-axial fatigue and critical plane analysis
Real-world loading is rarely simple uniaxial tension-compression. Rotating shafts, suspension components and welded frames all experience complex, multi-axial stress states that change direction during a load cycle. We apply multi-axial fatigue criteria — including the Dang Van criterion and critical plane methods — to correctly evaluate these situations, which standard uniaxial approaches would significantly overestimate or underestimate.
What you receive
Every fatigue project results in a clear, documented report containing the FEA model description, the applied load histories, material data and fatigue method, contour plots of the predicted fatigue life, identification of critical locations and failure modes, and actionable recommendations for design improvements where needed. We can also advise on optimal strain gauge placement for validation testing and provide virtual strain gauge results for direct comparison with physical measurements.
Concerned about fatigue in your design?
Whether you need to predict the fatigue life of a new product, investigate a field failure or extend the service life of an existing structure — our fatigue specialists have over 15 years of experience in solving durability problems across a wide range of industries.
Get in touch for a free initial consultation. We will discuss your loading conditions, review the available data and propose the right analysis approach for your situation.
Contact us or call us at +32 478 618 118Want to learn more about fatigue analysis? Have a look at our Introduction to Fatigue Calculations with FEA course.
Frequently asked questions
Common questions about fatigue analysis and durability assessment.