How to Recognise a Fatigue Fracture
When a component fails in service, one of the first questions is whether the failure was caused by material fatigue or by a single overload event. Fortunately, a fatigue fracture surface has a distinctive appearance that, with some practice, can be identified visually — often without any laboratory equipment. This article describes the telltale features of a fatigue fracture and explains what each zone of the fracture surface reveals about how the crack started, grew and finally caused failure.
What Causes Fatigue Cracks to Start?
A fatigue crack almost always initiates at a location of stress concentration: a fillet radius, a keyway, a hole, a surface scratch, a machining mark or a weld toe. Any geometric feature that locally amplifies the stress makes it easier for a micro-crack to nucleate under repeated loading. The applied stresses can be well below the material's static tensile strength — this is what makes fatigue so dangerous and why it can go undetected for a long time.
In welded structures, the probability of fatigue cracking is particularly high near the weld toe, where the stress concentration from the weld geometry combines with tensile residual stresses from the welding process. The surface condition of the part also plays a role: a rougher surface provides more potential crack initiation sites than a polished one.
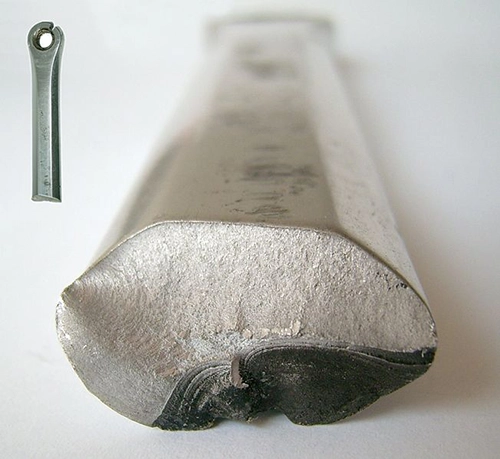
Anatomy of a Fatigue Fracture Surface
A fracture surface produced by fatigue has three distinct zones, each with a characteristic appearance (see Figure 1):
- Initiation site: the point (or points) where the crack first formed. Under magnification, this area appears smooth and may coincide with a visible surface defect, a sharp corner or a change in cross-section. In many cases the initiation site can be traced back to the root cause of the failure.
- Propagation zone: as the crack grows cycle by cycle, it leaves behind two types of characteristic markings:
- Striations — fine, closely spaced lines visible under high magnification (typically SEM) that represent the incremental advance of the crack front during each loading cycle.
- Beach marks — broader, concentric arcs that radiate from the initiation site and are often visible to the naked eye. Beach marks form when the loading conditions change (e.g. a machine is started and stopped, or the load amplitude varies over time) and they map the history of crack growth over the service life. Their characteristic concentric pattern gives the fracture its typical "clamshell" appearance.
- Final fracture area: when the crack has reduced the remaining cross-section to the point where it can no longer carry the peak load, the component breaks suddenly. This final fracture zone is rough and irregular — in ductile materials it shows fibrous tearing with dimples, in brittle materials it may appear granular or crystalline. The contrast between the smooth propagation zone and the rough final fracture area is usually unmistakable.
The relative size of the propagation zone and the final fracture area gives an indication of the loading severity. A large, smooth propagation zone with a small final fracture area indicates relatively low cyclic stresses acting over many cycles (high-cycle fatigue). Conversely, a small propagation zone and a large rough area suggest higher stresses and fewer cycles to failure.
Why It Matters for Engineering Practice
Being able to read a fracture surface is a valuable skill, but the real goal is to prevent fatigue failures from occurring in the first place. A proper fatigue and durability analysis during the design phase identifies the critical stress concentrations, quantifies the expected fatigue life and allows engineers to modify the design before the component ever enters service. When a fatigue failure does occur, fracture surface examination (fractography) feeds back into this process by revealing the initiation site and loading history, enabling root cause analysis and design improvement.
To learn more about fatigue assessment methods, take a look at our course Introduction to Fatigue Analysis with FEA.
Frequently asked questions
Common questions about recognising fatigue fractures.