The Challenge
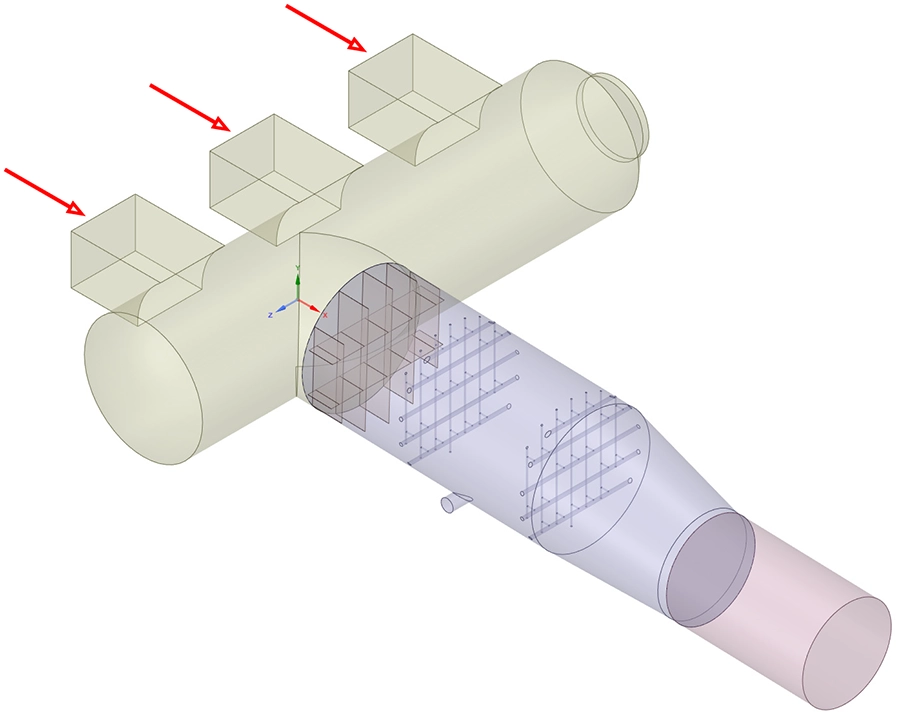
An ozone injection duct at a major steel production facility in the Netherlands was experiencing concerns about vortex shedding. The duct, with a variable diameter of 6 to 8 metres and a total length of 23.7 metres, carries a hot gas mixture at 130 °C with a total mass flow of approximately 482 kg/s. Inside the duct, a series of guiding plates (baffles) and ozone injection tubes are directly exposed to the gas flow.
The operator needed to verify whether fluctuating pressure loads caused by vortex shedding in the flow could excite the natural frequencies of the internal components, potentially causing resonance, excessive vibrations and ultimately structural failure. Four different inlet mass flow distributions had to be assessed to cover the full operational envelope of the installation.
Our Approach
We performed a fully coupled CFD–FEA analysis: the time-dependent pressure field computed by the flow simulation was directly applied as a load on the structural finite element model. This two-way coupling captures the true dynamic interaction between the gas flow and the duct internals, which cannot be achieved with simplified hand calculations or uncoupled analyses.
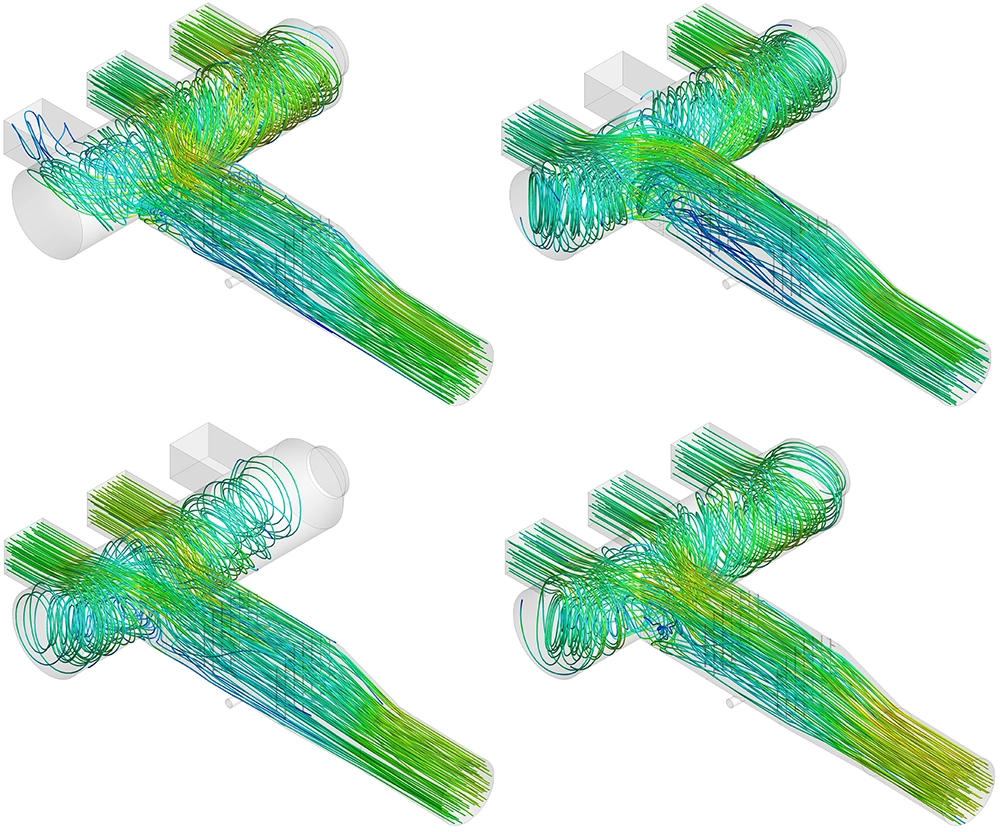
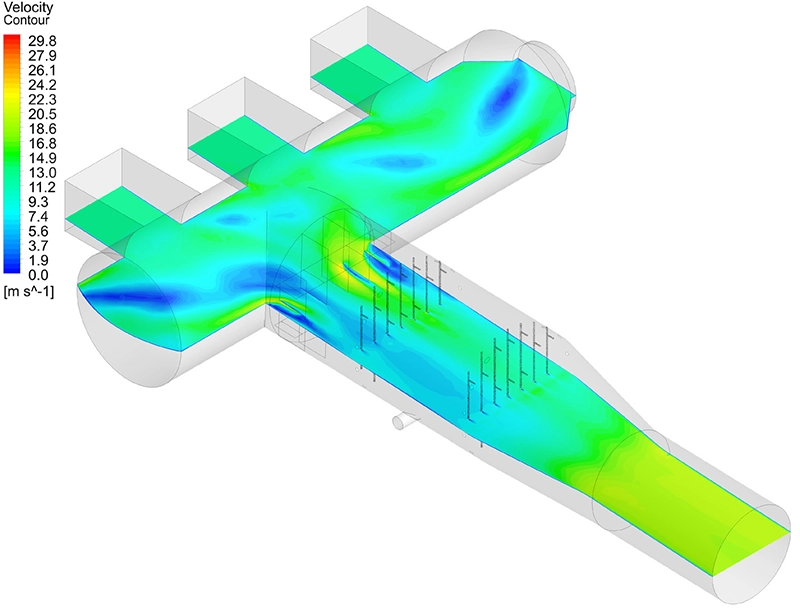
Transient CFD analysis
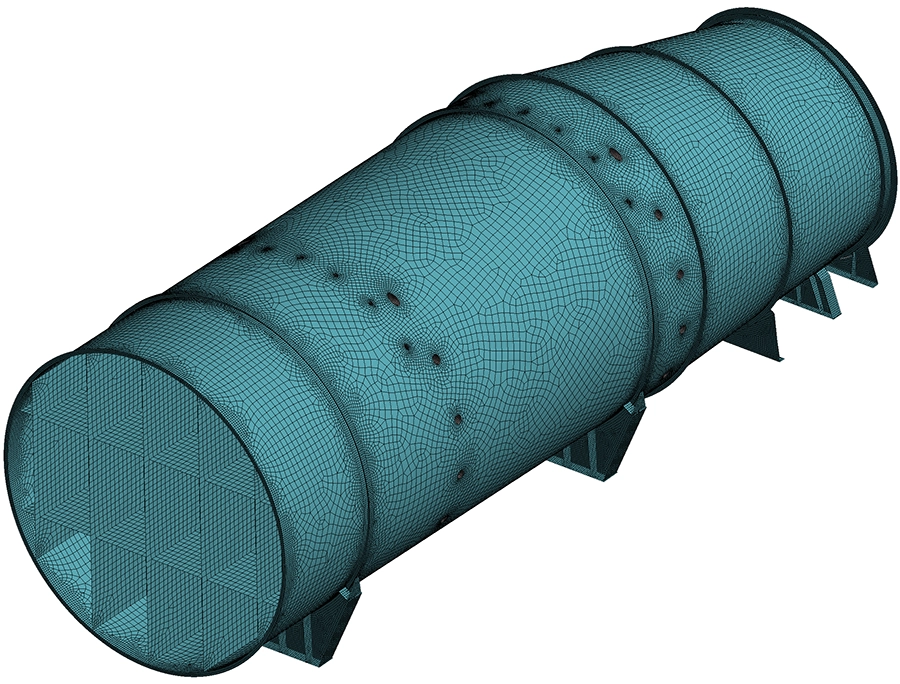
The internal flow domain was meshed with polyhedral elements and solved as a transient simulation using the k-ω SST turbulence model in Ansys Fluent. Four inlet scenarios were defined, each distributing the total mass flow of 482 kg/s across the three inlets in different proportions ranging from 0% to 55%. Velocity time series were recorded at four monitoring points near the baffles and injection tubes, and a Fast Fourier Transform (FFT) was applied to identify the dominant excitation frequencies in the flow. The FFT results indicated that the largest frequency contributions fell between 0.5 and 3 Hz.
Modal analysis
On the structural side, we performed a modal analysis of the guiding plates and injection tubes. The FEA mesh used 2D shell elements, well suited for the thin-walled plate and tube geometry. The first eigenfrequency of the baffles was found at 4.1 Hz, close to but above the dominant flow frequencies. The tube eigenfrequencies started at 8.8 Hz and 9.5 Hz, well separated from the vortex shedding frequencies. These preliminary results suggested a low risk of resonance, but confirmation through the fully coupled analysis was essential.
Coupled transient CFD-FEA simulation
Based on the FFT results, a time step of 0.001 s was selected for the coupled simulation, ensuring that all frequencies up to 10 Hz were accurately resolved with at least 60 steps per cycle. The transient pressure field from Ansys Fluent was mapped directly onto the structural model in Ansys Mechanical at every time step. Gravitational loads and the weight of the external insulation (100 mm mineral wool plus 1 mm aluminium cladding, adding 10.7 kg/m3) were also included in the structural model. Two different alloys were assigned to the duct components: duplex stainless steel S32205 and nickel alloy C276, with mechanical properties evaluated at the operating temperature of 130 °C.
Results
The coupled CFD-FEA results confirmed that the ozone duct internals are structurally safe under all four operating scenarios. The maximum deformation across all cases was 3.8 mm, occurring in the guiding plates under inlet scenario 2 (55% through inlet 1, 45% through inlet 3, inlet 2 closed). The deformations in the injection tubes remained well below 1 mm in all cases.
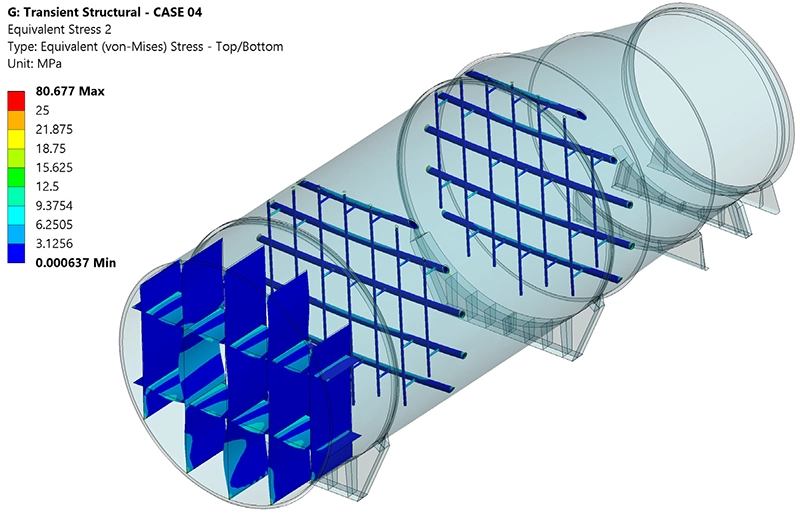
The maximum Von Mises stress reached 84 MPa, again in the baffles under scenario 2. This is far below the yield stress of both materials: 345 MPa for S32205 and 246 MPa for C276 at the operating temperature. The safety margin is therefore substantial, with the peak stress representing less than 25% of the lowest yield strength.
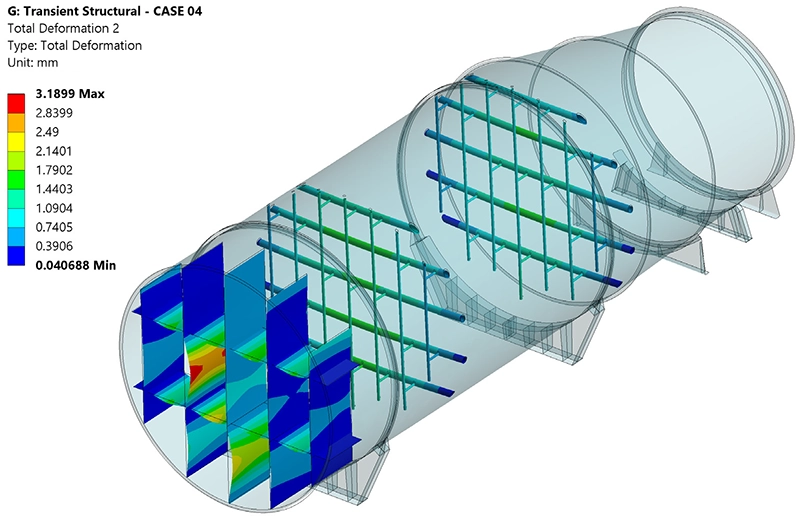
Critically, the time history plots of both the deformations and stresses showed no dynamic amplification over successive cycles. While the guiding plates exhibited a periodic response driven by the low-frequency vortex shedding, the amplitude remained stable and did not grow over time. This confirmed the absence of resonance and fatigue risk. For the injection tubes, the response was even more benign: the vortex shedding frequencies (0.5–3 Hz) were far removed from the tube eigenfrequencies (8.8–9.5 Hz), resulting in negligible dynamic effects.
Value Delivered
The fully coupled CFD–FEA approach provided a level of insight that separate, uncoupled analyses cannot achieve. By directly transferring the transient pressure field from the flow solver to the structural solver at every time step, we captured the true dynamic loading on the duct internals, including the complex, non-uniform and time-varying pressure distribution caused by the merging of three inlet flows.
The analysis conclusively demonstrated that vortex shedding poses no structural risk to the guiding plates or injection tubes under any of the four operational scenarios. Deformations and stresses remain well within acceptable limits, and no resonance or dynamic amplification was observed. This gave the operator the confidence to proceed with the installation, backed by rigorous simulation evidence rather than conservative design assumptions that might have led to unnecessary and costly reinforcement.
Need a vortex shedding or fluid-structure interaction analysis?
Whether you are dealing with flow-induced vibrations, coupled CFD-FEA problems or dynamic structural assessments, our team has the expertise and software tools to deliver robust, quantitative answers. Get in touch for a free initial consultation.
Contact us or call us at +32 478 618 118