The Challenge
A process industry client required a detailed flow and thermal analysis of a 230 kW electrical circulation heater used for heating a high-temperature process fluid. The fluid enters the heater at temperatures between 320 °C and 330 °C and flows past an array of electric heating elements before exiting at the opposite end. Understanding the internal temperature distribution is critical because the process fluid has a critical degradation temperature of 410 °C — any sustained exposure above this threshold risks irreversible fluid breakdown and potential equipment damage.
Two alternative internal baffle configurations were under consideration: a "Central Tube" arrangement and a "Segmental Baffle" layout. The client needed a quantitative comparison of both designs under realistic operating conditions, covering pressure drop, heat loss through the insulation, outlet fluid temperature and, most importantly, the maximum wall and fluid temperatures near the heating elements.
Our Approach
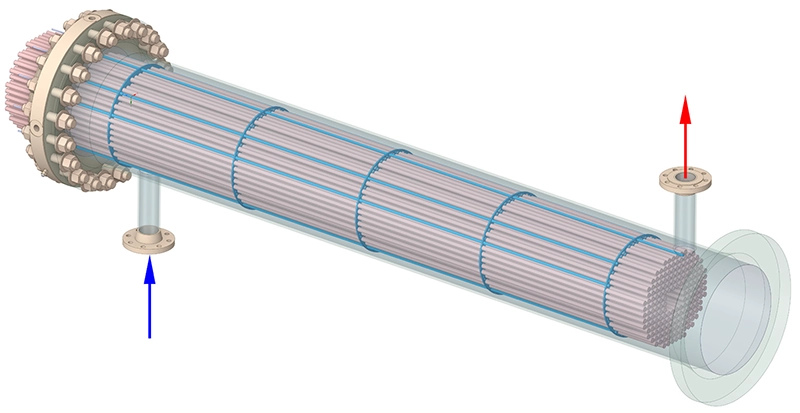
We built full 3D CFD models of both heater configurations in Ansys Fluent, capturing the complete internal geometry including the heater shell, all heating elements, baffles, the central tube and the inlet and outlet nozzles.
Temperature-dependent fluid properties
Because the process fluid's properties change substantially over the operating temperature range, all material properties — thermal conductivity, specific heat capacity, density and dynamic viscosity — were implemented as polynomial or power-law functions of temperature. The viscosity, for instance, drops by several orders of magnitude between ambient and operating temperature, making accurate curve fits essential for reliable predictions.
Boundary conditions and flow regime
Reynolds number calculations confirmed laminar flow conditions for all cases (Re = 503 at 20 m3/h and Re = 1,747 at 60 m3/h), allowing the use of a steady-state laminar solver. The heating elements were modelled with a uniform heat flux of 7,880 W/m2 corresponding to the total 230 kW heater power distributed across 29.2 m2 of element surface area. The outer heater wall was assigned a heat transfer coefficient calculated from the 120 mm rockwool insulation layer and the 304L stainless steel shell.
Multi-configuration, multi-condition analysis
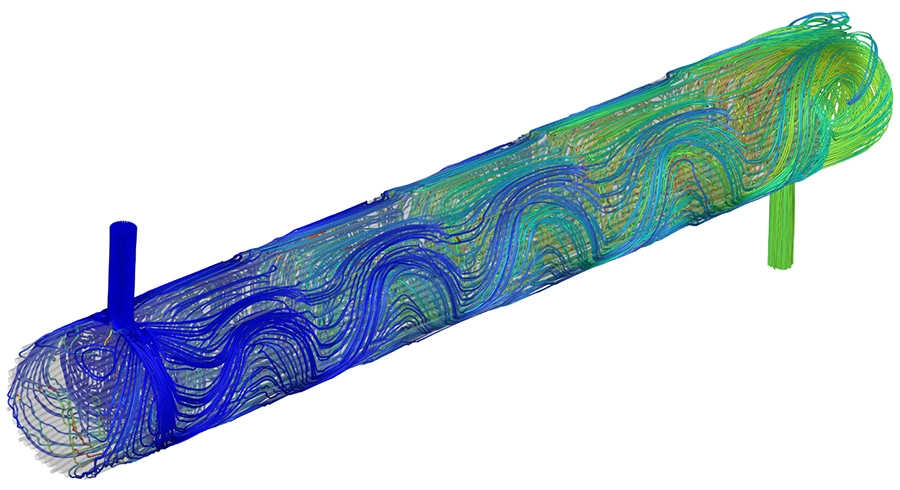
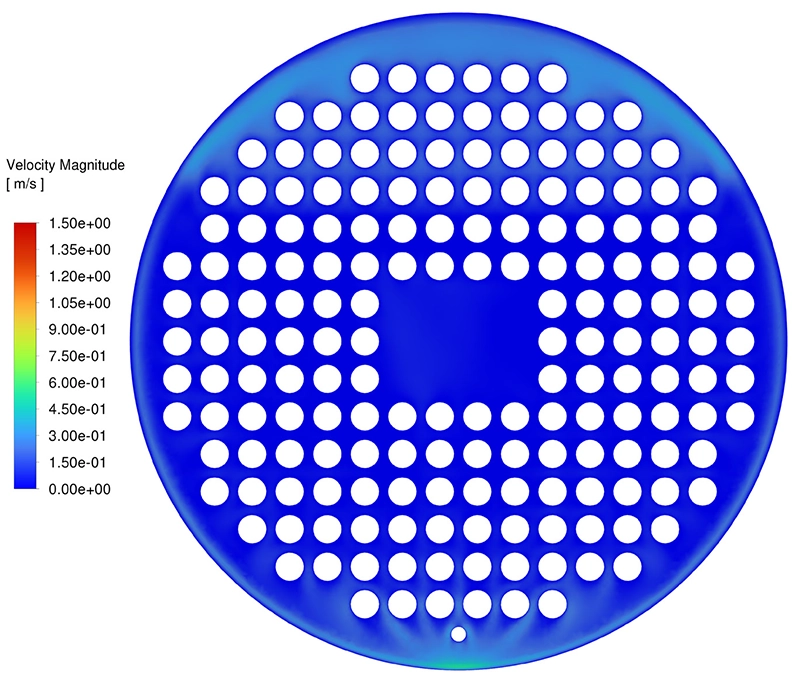
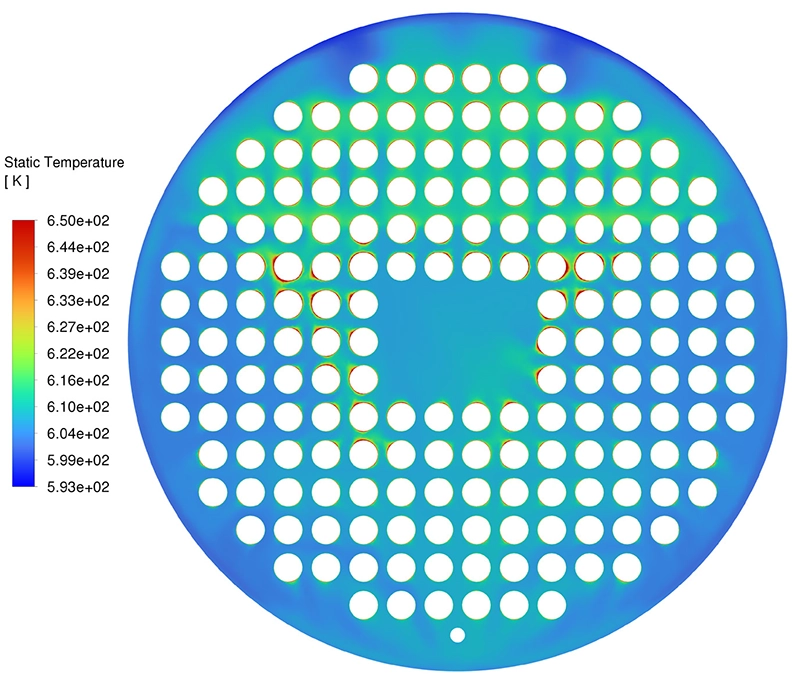
Three full CFD runs were performed: the Central Tube configuration at 20 m3/h (320 °C inlet) and at 60 m3/h (330 °C inlet), plus the Segmental Baffle configuration at 20 m3/h (320 °C inlet). For each case, velocity contour plots, temperature contour plots, iso-surface plots (highlighting regions above the critical 410 °C) and streamline visualisations were generated on multiple section planes throughout the heater.
Results
All three analyses confirmed that the heater successfully raises the fluid temperature by approximately 15 °C (from 320 °C to 335 °C), with insulation losses of only around 490–508 W — negligible compared to the 230 kW input power.
The critical finding concerned the wall temperatures. Under the low-flow condition (20 m3/h), the Central Tube configuration reached a maximum heater element wall temperature of 625 °C, while the Segmental Baffle design achieved a significantly lower maximum of 571 °C under the same flow conditions. Although both exceed the 410 °C fluid degradation threshold at the element surface, the iso-surface analyses demonstrated that these extreme temperatures are confined to very thin boundary layers directly adjacent to the heating elements. The bulk fluid temperature drops rapidly away from the walls.
At the higher flow rate (60 m3/h), the Central Tube configuration benefited substantially from the improved convective cooling: the maximum wall temperature dropped from 625 °C to 474 °C, and the average wall temperature decreased from 416 °C to 386 °C. The pressure drop, however, increased considerably from 2,373 Pa to 18,003 Pa due to the higher velocities through the narrow passages between the elements.
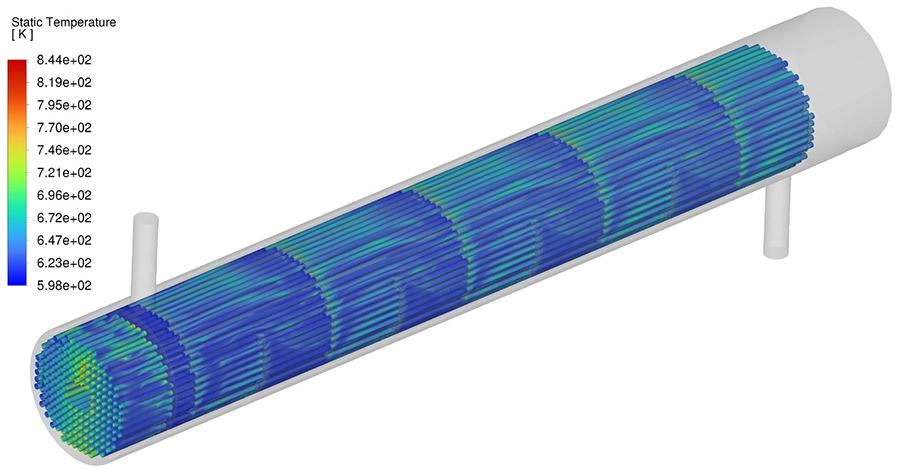
The Segmental Baffle configuration showed notably more uniform flow distribution at the low flow rate. The segmental baffles force the fluid to change direction repeatedly as it travels through the heater, promoting better mixing and more even heat absorption compared to the predominantly axial flow pattern of the Central Tube design. This improved mixing contributes directly to the lower peak wall temperatures observed.
Value Delivered
The CFD analysis gave the client a clear, quantitative basis for selecting the optimal heater configuration. Rather than relying on simplified analytical estimates, the simulation revealed the actual temperature distribution throughout the fluid domain and on every wall surface, providing direct evidence of where and how severely the critical fluid temperature is exceeded.
The study delivered a detailed comparison of both baffle configurations under matched operating conditions, confirmation that the bulk fluid remains well below the degradation threshold despite localised high temperatures at the element walls, a comprehensive dataset of pressure drops for pump sizing, and the visualisations needed for engineering review and procurement decisions. The combination of CFD simulation and thermal analysis allowed the client to proceed with confidence in the selected design.
Need thermal or flow analysis for your heat exchanger or process equipment?
Whether you are designing a new heater, comparing configurations or troubleshooting thermal hotspots, we can help with detailed CFD and thermal analysis. Get in touch for a free initial consultation.
Contact us or call us at +32 478 618 118