The Challenge
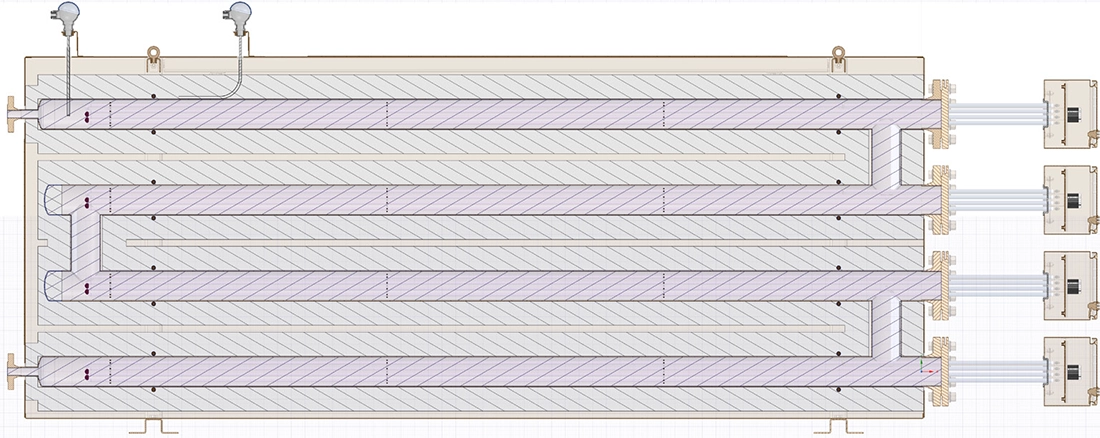
A manufacturer of electric heating equipment needed to validate the design of a 20 kW fluid circulation heater used for heating tar from 60 °C to its target outlet temperature. The heater consists of four stacked tubular heating compartments with internal electric heating elements, rated at 6, 6, 5 and 3 kW respectively. Tar enters at the bottom of the heater and flows upward through each compartment in a serpentine path before exiting at the top.
The key engineering questions were threefold: what is the pressure drop across the heater — both during the critical cold start at 60 °C when the tar is extremely viscous, and during steady-state operation at elevated temperatures? How much heat is lost through the insulation? And what is the average temperature of the tar at the heater outlet?
These answers are essential for pump sizing, insulation specification and confirming that the heater can deliver the required thermal performance under real-world operating conditions.
Our Approach
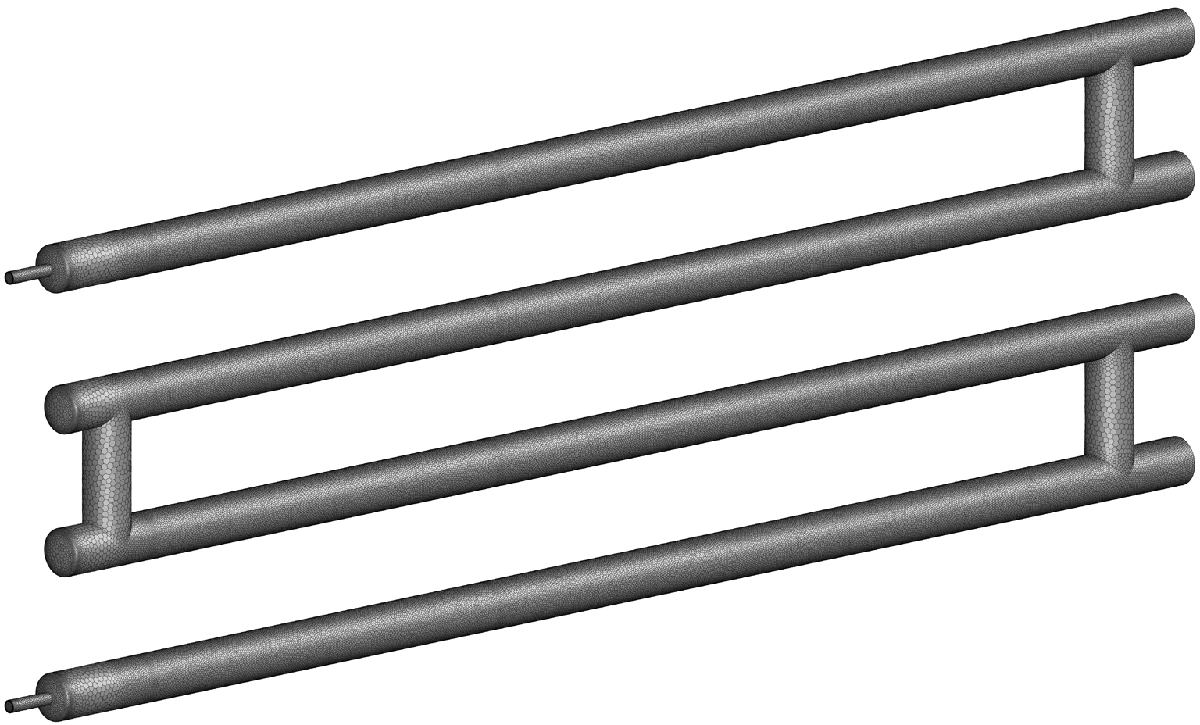
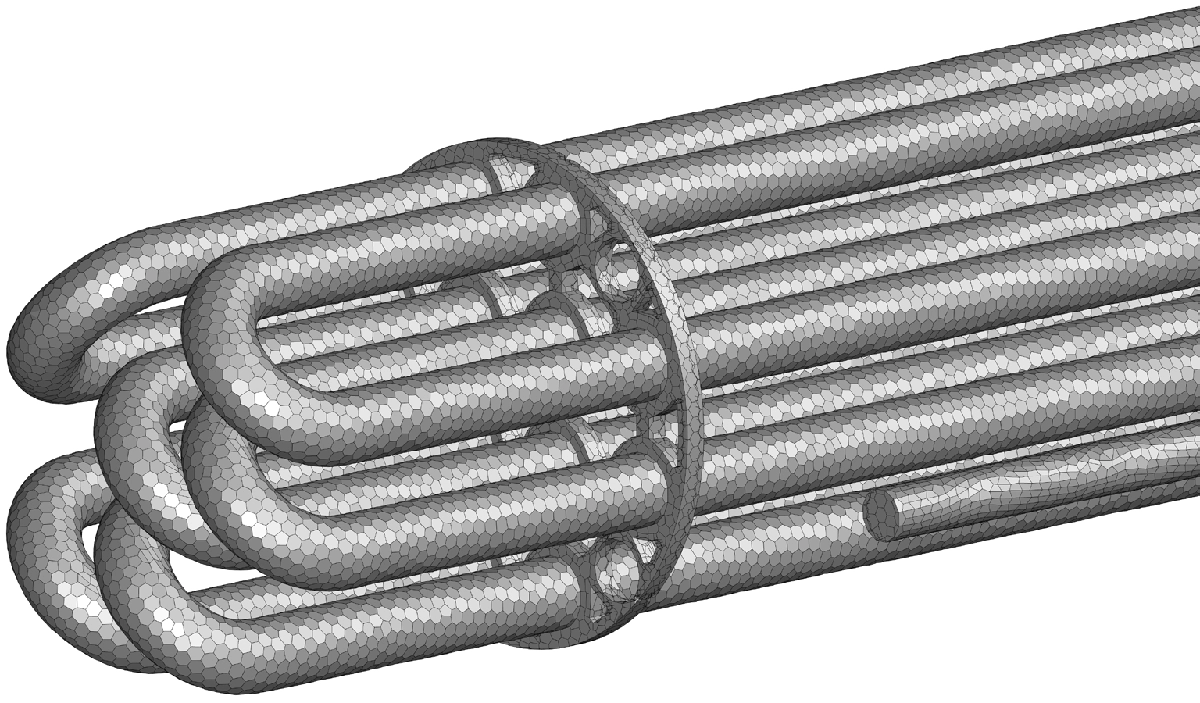
We built a full 3D CFD model of the internal fluid volume in Ansys Fluent, capturing the complete flow path including all four heating compartments, the connecting passages between them and the inlet and outlet nozzles.
Modelling highly non-linear fluid properties
The defining challenge of this project was the tar's extreme temperature-dependent behaviour. Between 50 °C and 100 °C, the dynamic viscosity drops from 0.86 Pa·s to 0.04 Pa·s — a factor of more than 20. This enormous variation follows a power-law relationship and has a decisive impact on both the flow regime and the pressure drop. The density and specific heat capacity were also implemented as temperature-dependent polynomial functions based on measured product data, ensuring that the simulation accurately tracks how the tar's physical behaviour changes as it heats up through the four compartments.
Laminar flow regime confirmed by Reynolds number analysis
Before running the CFD simulation, we calculated the Reynolds number at both extremes of the operating temperature range. At the cold-start temperature of 60 °C, the Reynolds number is approximately 1.1; at the maximum operating temperature of 400 °C, it rises to about 479. Both values are well below the laminar-to-turbulent transition threshold, confirming that a steady-state laminar solver is appropriate for this application and avoiding the additional computational cost and uncertainty of turbulence modelling.
Boundary conditions and insulation modelling
Each of the four heating elements was modelled as a wall with a uniform heat flux corresponding to its rated power distributed over the element surface area (ranging from 3,216 to 6,432 W/m2). The outer heater wall was assigned a calculated overall heat transfer coefficient of 0.929 W/m2·K, derived from the 70 mm stone wool insulation, the 304L stainless steel shell and the natural convection on the external surface at an ambient temperature of 5 °C. A separate analysis with constant fluid properties at 60 °C was run to determine the cold-start pressure drop.
Results
The CFD analysis produced clear, quantitative answers to all three engineering questions. The pressure drop during cold start at 60 °C was found to be 1,730 Pa — nearly ten times higher than the 184 Pa measured during normal operation. This significant difference is driven entirely by the tar's extremely high viscosity at low temperature and is critical information for pump sizing and start-up procedure design.
The heat loss through the insulation was calculated at 609 W, representing approximately 3% of the total 20 kW heater power. While this confirms the insulation is performing adequately, the loss is not negligible and was accounted for when predicting the outlet conditions.
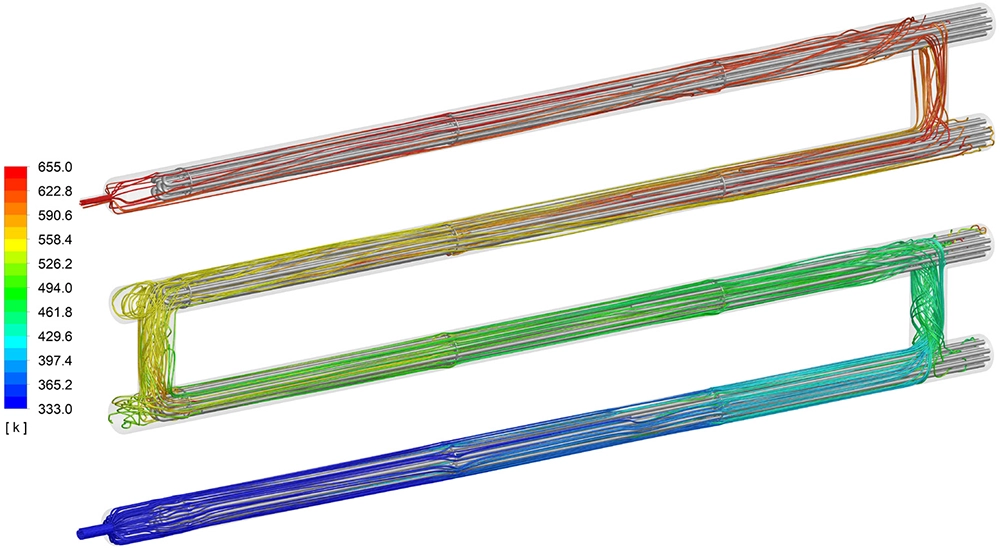
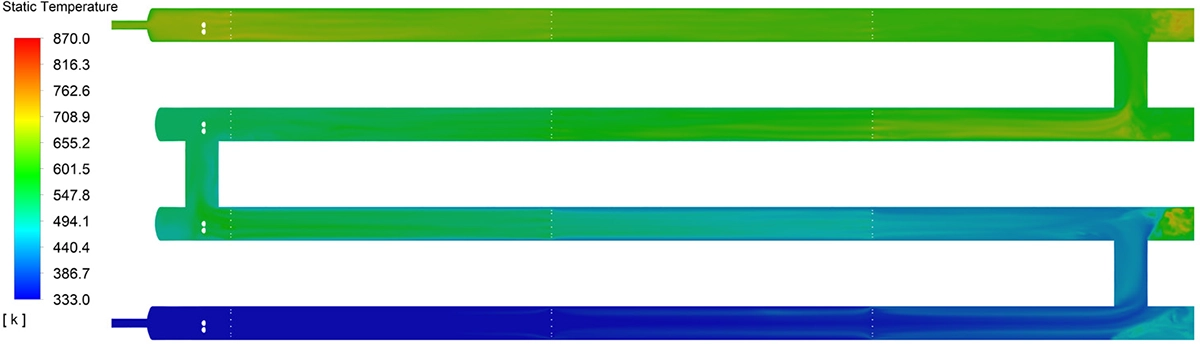
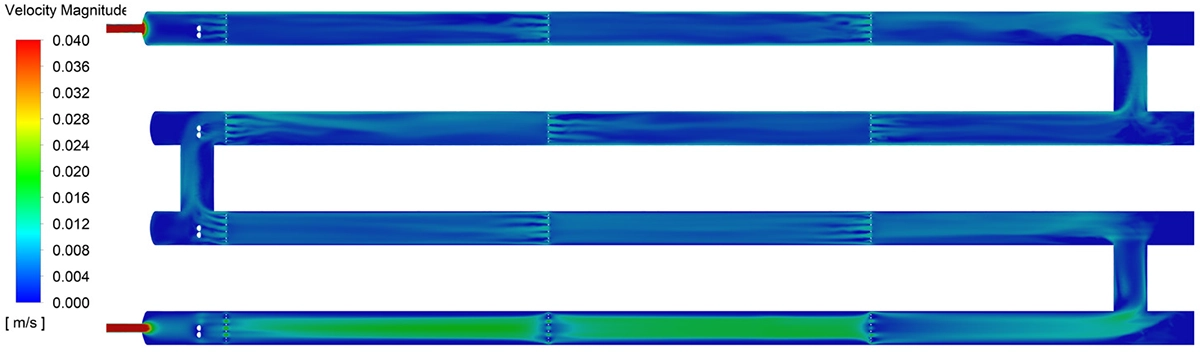
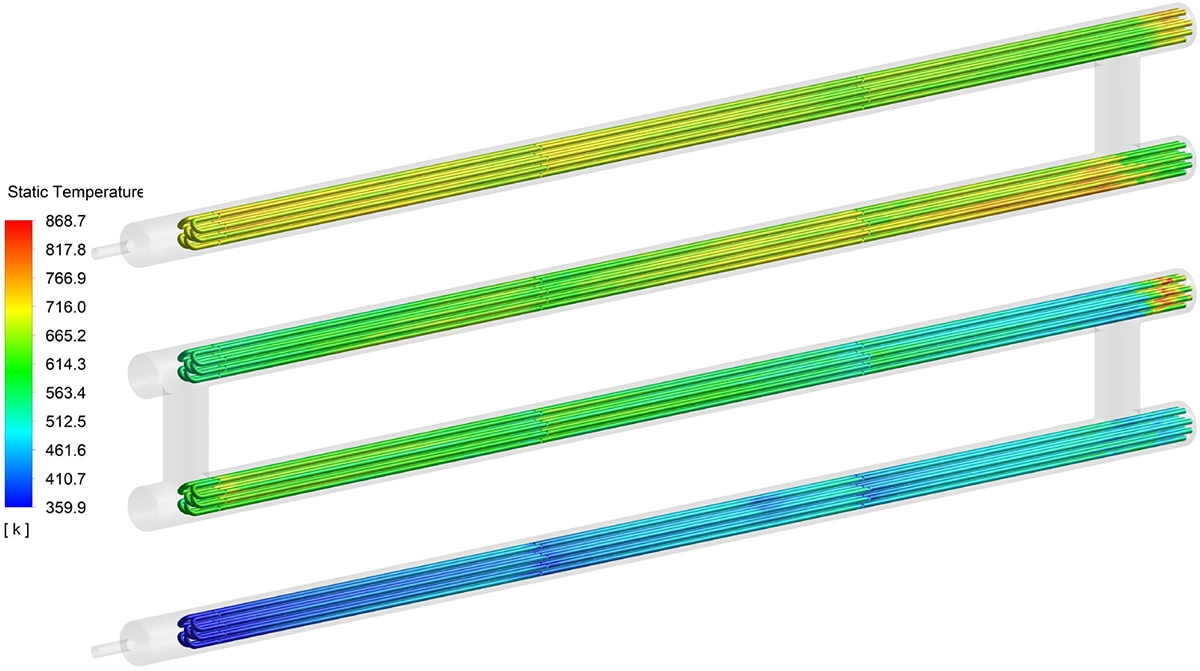
The simulation predicted an average outlet temperature of 380 °C with a mean flow temperature across the entire fluid volume of 250 °C. Temperature contour plots on multiple section planes revealed a progressive temperature increase through the four compartments, with the tar absorbing heat primarily near the tube walls where the thermal boundary layers develop. The streamline visualisations confirmed a smooth, well-ordered flow pattern consistent with the laminar regime.
The heater element wall temperatures were also extracted at twelve locations along the four compartments. The results ranged from an average of 104 °C at the inlet end of the first heater to 430 °C at the outlet end of the fourth heater, with a maximum local temperature of 490 °C. These element temperature maps provide the manufacturer with the data needed to verify that the heating elements operate within their rated temperature limits and to assess the risk of local tar degradation near the hottest surfaces.
Value Delivered
The CFD analysis transformed what would otherwise be an uncertain design into a validated, quantified product. The cold-start pressure drop of 1,730 Pa — an order of magnitude higher than the operating value — is information that cannot be obtained from simplified hand calculations when dealing with a fluid whose viscosity varies by a factor of 20 over the operating temperature range. Without this data, the pump would almost certainly have been undersized for start-up conditions.
The detailed element temperature maps allow the manufacturer to verify that every section of every heating element operates within its design limits, and to identify which locations experience the highest thermal load. The combination of CFD and thermal analysis provided comprehensive performance data — pressure drop, heat loss, outlet temperature and wall temperatures — in a single simulation campaign, giving the client a complete picture of the heater's thermal-hydraulic performance before the first prototype was built.
Designing or validating a heater, heat exchanger or process equipment?
From flow analysis and thermal performance prediction to design optimisation, we help manufacturers quantify performance before committing to production. Get in touch for a free initial consultation.
Contact us or call us at +32 478 618 118