The Challenge
During the modification of flue gas ducting at an ESP dedusting unit in a refinery, the engineering contractor needed accurate pressure drop data for a T-section where the duct splits into two branches, each controlled by a shut-off valve. Depending on operational conditions, either the left or the right valve is open while the other remains closed, directing the full flue gas flow through one branch at a time.
Standard handbook correlations for T-junctions assume idealised geometries and do not account for the actual duct shape, the upstream bends, the transition pieces or the valve housings present in this installation. This makes it difficult to determine a reliable equivalent pipe length for the T-section — a value that process engineers need to correctly size fans and predict the overall system pressure drop.
The client required a CFD simulation to determine the total pressure drop and the corresponding equivalent length for both valve configurations, based on the actual 3D geometry of the duct assembly.
Our Approach
We performed a steady-state CFD analysis in Ansys Fluent using the k-ω SST turbulence model for each of the two operating configurations.
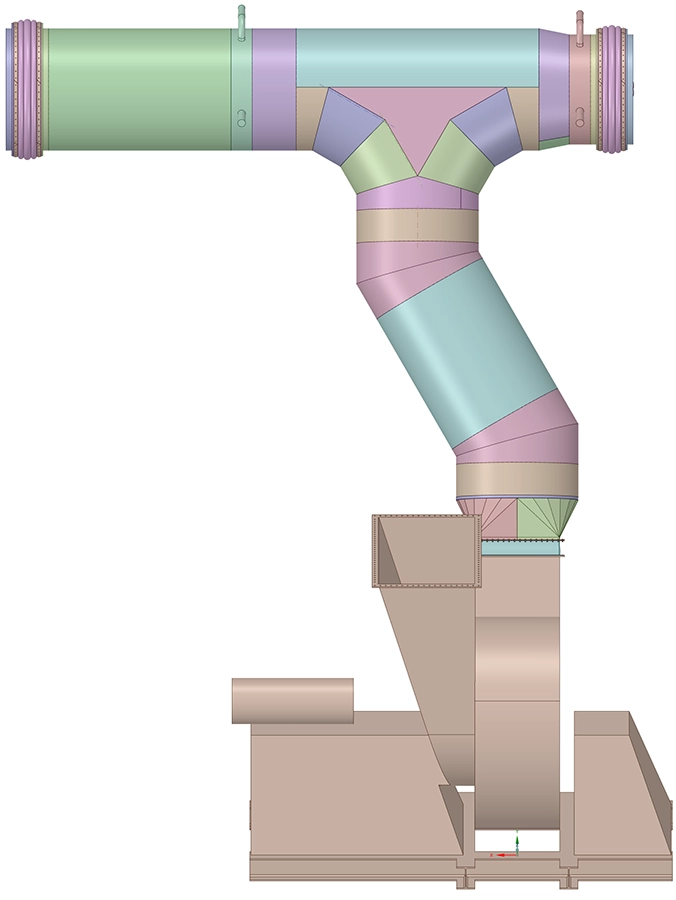
Geometry and fluid domain
The fluid domain was extracted from the as-designed 3D model of the duct assembly. For each case, the branch with the closed valve was removed from the domain since no flow passes through it. An extension was added downstream of the outlet to ensure numerical stability and prevent back-flow artefacts from influencing the pressure results at the measurement plane.
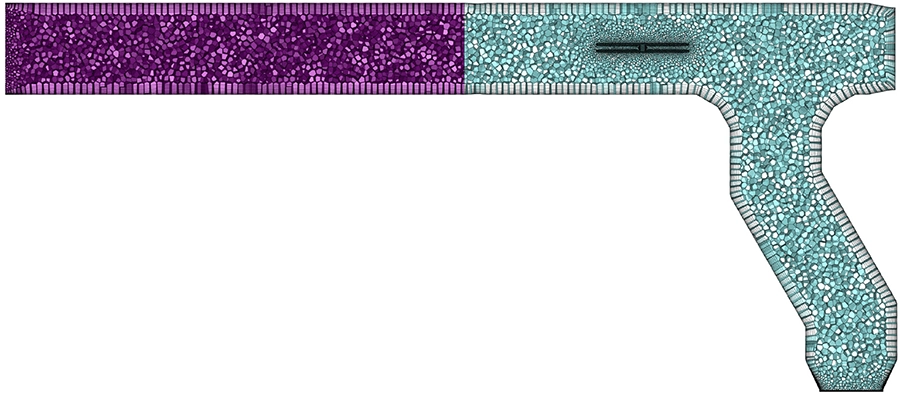
Meshing strategy
An unstructured mesh was generated with particular attention to the near-wall resolution: 10 inflation layers were applied along the channel walls to properly resolve the boundary layer. This level of refinement is essential for accurately capturing wall shear stress and friction losses in high-Reynolds-number internal flows.
Boundary conditions
The flue gas enters the duct at a mass flow rate of 160,000 kg/h (corresponding to a mean velocity of approximately 27.5 m/s in the 2 m diameter channel). Rather than applying a uniform velocity profile at the inlet, we imported a fully developed turbulent velocity profile obtained from a separate precursor simulation. This approach eliminates the artificial pressure loss that would occur in the development length region, resulting in a more precise calculation of the pressure drop attributable solely to the T-section.
The flue gas properties were specified at the operating temperature of 290 °C: a density of 0.65 kg/m3 and a dynamic viscosity of 2.8 × 10⁻⁵ Pa·s. At these conditions the flow Reynolds number exceeds 106, firmly placing it in the fully turbulent regime.
Pressure drop and equivalent length derivation
The total pressure drop across the T-section was calculated as the difference in total pressure (static + dynamic) between the inlet and outlet measurement planes, using area-weighted averages on each cross-section. From the computed pressure drop, the loss coefficient KL was determined, and the equivalent pipe length was derived using the Darcy friction factor (f = 0.0121 at Re = 1.01 × 10⁶ for commercial steel with a roughness of 0.045 mm).
Results
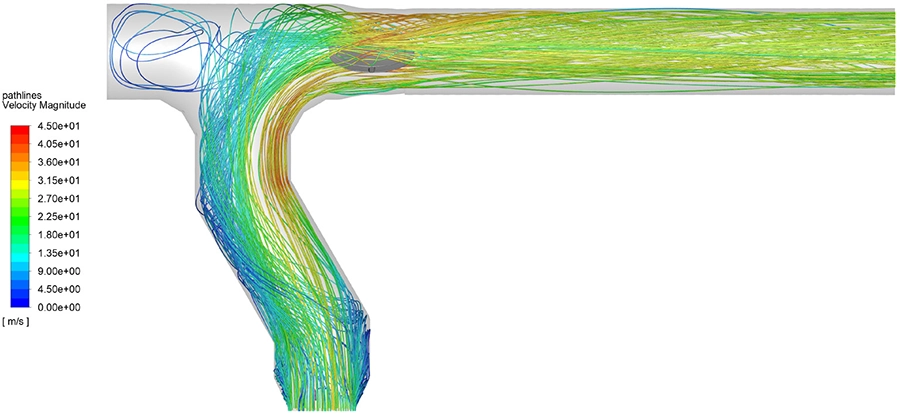
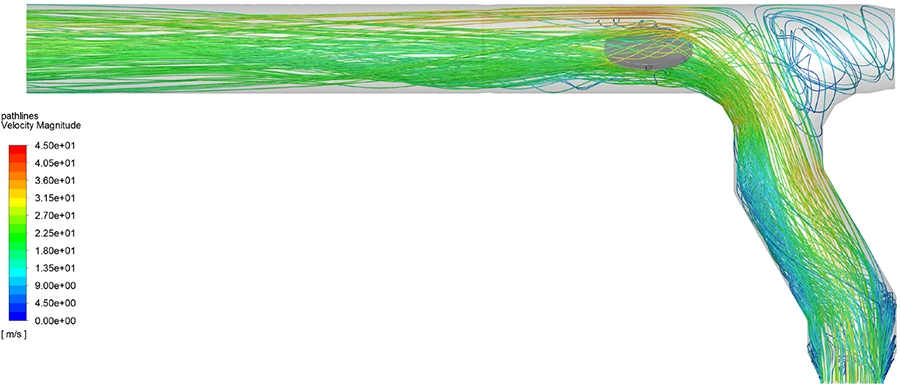
The CFD simulations revealed distinctly different flow patterns for the two valve configurations. With the right valve open, the flue gas is redirected through a more complex series of bends before reaching the outlet, whereas the left-valve-open path involves a straighter trajectory through the main duct.
Streamlines and velocity distribution
Streamline visualisations showed the expected flow separation zones at the T-junction and within the branch bends. Local velocities up to 45 m/s were observed in the constricted transition pieces, approximately 1.6 times the mean channel velocity. These acceleration zones contribute significantly to the overall pressure loss through increased turbulent mixing and localised friction.
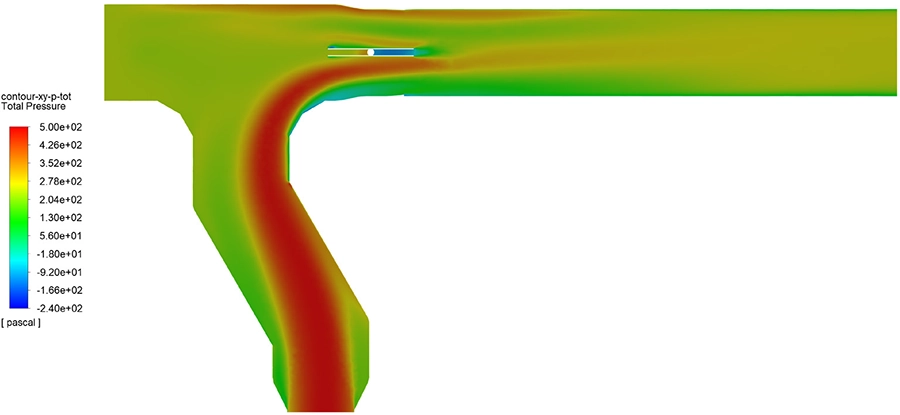
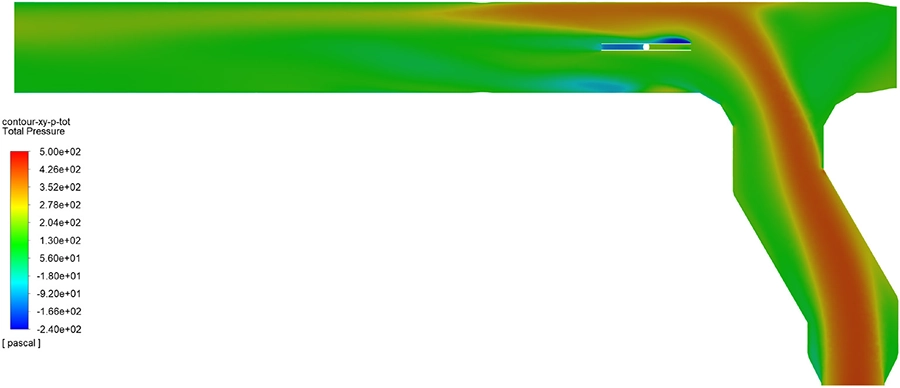
Pressure contours
Contour plots of both static and total pressure provided a clear visual representation of where energy is lost. The largest pressure gradients occur at the T-junction itself and at the sharp transitions between duct sections. The total pressure contours confirmed that the right-valve path, with its additional bends, produces a more significant pressure loss.
Quantitative results
The table below summarises the calculated pressure drops and equivalent pipe lengths for both operating configurations.
| Configuration | Total Pressure Drop | Loss Coefficient KL | Equivalent Length |
|---|---|---|---|
| Right valve open | 139.8 Pa | 0.91 | 150 m |
| Left valve open | 161.0 Pa | 1.05 | 173 m |
The left-valve-open configuration produces a 15% higher pressure drop (161 Pa vs. 139.8 Pa), corresponding to an equivalent length of 173 m compared to 150 m for the right-valve path. Although the left-valve path appears geometrically more direct, the specific arrangement of transition pieces and the flow turning angle at the T-junction produce greater losses in this configuration.
Value Delivered
The CFD-derived equivalent lengths allowed the process engineering team to accurately account for the T-section in the overall system pressure drop calculations, replacing uncertain handbook estimates with geometry-specific values. This is particularly important for high-temperature flue gas systems, where the low gas density and high flow velocities amplify the effect of local losses on fan sizing and energy consumption.
By analysing both valve configurations, the study also confirmed that the worst-case pressure drop (left valve open, 173 m equivalent length) should be used as the design basis for fan selection, ensuring sufficient margin for all operating conditions.
The delivered results included the pressure drop and equivalent length for both configurations, detailed contour plots and streamline visualisations for engineering review, and the Darcy friction factor and loss coefficient calculations that enable the client to integrate the CFD results directly into their piping system hydraulic model.
This type of geometry-specific pressure drop characterisation through CFD simulation is routinely applied to pipe fittings, valves, heat exchangers, and other flow components where standard correlations fall short — especially in the process industry, where operating conditions often deviate significantly from the assumptions built into handbook data.
Need accurate pressure drop data for your duct or piping system?
Whether you need to characterise a complex fitting, optimise a duct layout, or validate structural loads from flow-induced forces, our simulation team can deliver the answers your design process needs. Get in touch for a free initial consultation.
Contact us or call us at +32 478 618 118