The Challenge
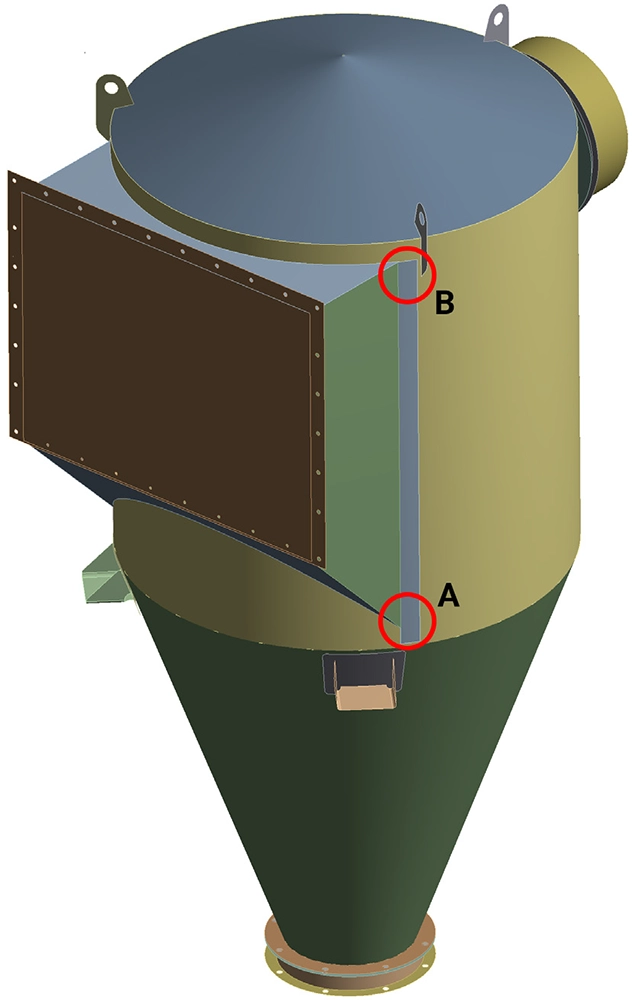
A welded steel storage bunker used in a bulk material handling operation was developing fatigue cracks at several weld locations. The cracks were appearing at the junction where the conical hopper section, the cylindrical shell and internal stiffener plates meet — a geometrically complex area where multiple plates converge at a single point, creating severe stress concentrations.
The bunker operates under cyclic vacuum loading: a pressure cycle from 0 to −500 mbar and back, repeated approximately 6.5 times per hour. Over weeks and months of continuous operation, these load cycles accumulate rapidly, making weld fatigue a critical design concern. The client needed to understand why the cracks were forming, predict the remaining weld life, and evaluate whether a proposed geometric modification (adding reinforcement ribs) would meaningfully extend the service life.
Our Approach
We employed a multi-level Finite Element Analysis strategy combined with dedicated weld fatigue life prediction to provide both a root-cause explanation and a quantified design improvement path.
Global shell model
The full bunker structure was modelled with 2D shell elements to capture the overall deformation pattern and stress distribution under the 500 mbar vacuum load. The structure is supported on three consoles that are vertically restrained but free to move radially. This global model revealed the high-stress regions at locations A and B, confirming that these are the critical areas where the geometry forces multiple load paths to converge.
Break-out submodel with 3D weld geometry
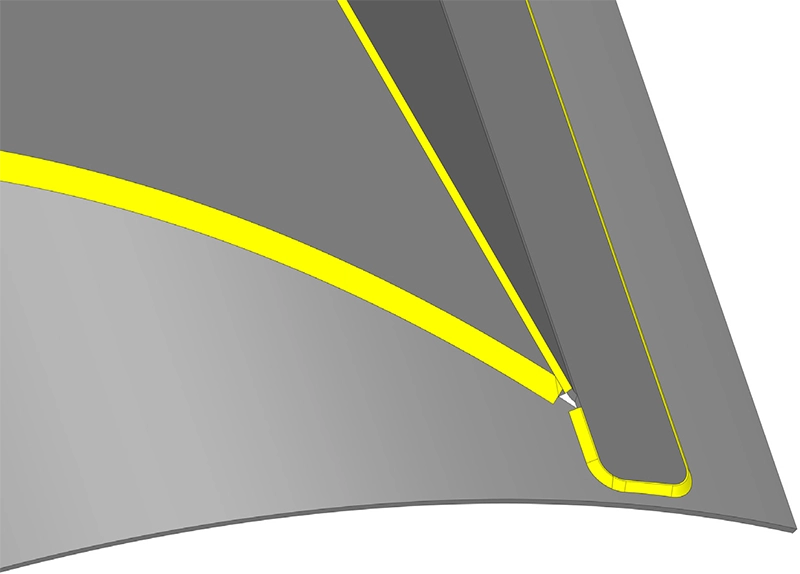
For accurate fatigue predictions, stress results from shell models are insufficient because they cannot capture the true weld toe geometry. We therefore created a detailed 3D solid break-out model of the critical region, in which every weld was explicitly modelled as 3D geometry with its actual cross-section shape. Nodal displacements from the global shell analysis were applied as boundary conditions, enabling a highly refined mesh around each weld without prohibitive computational cost.
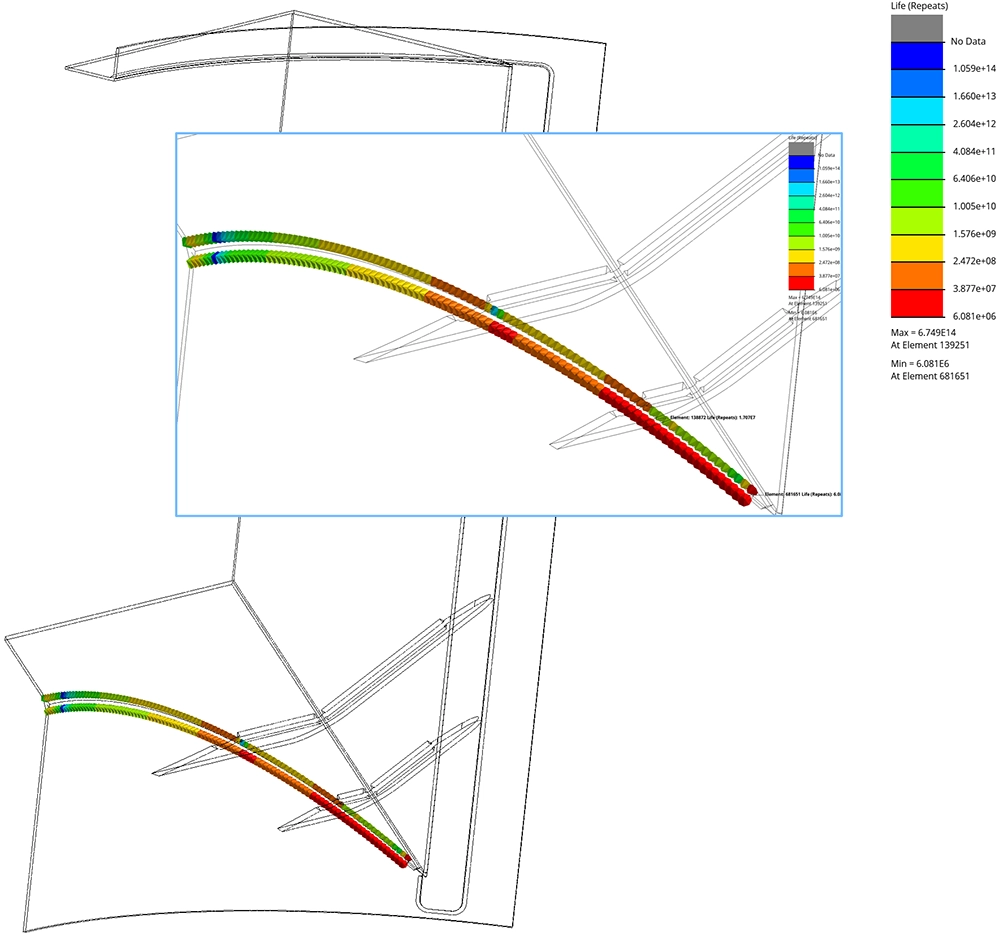
Seam weld fatigue analysis
The fatigue life of each weld was computed in HBM nCode DesignLife using the Solid Seam Weld method. This approach uses nodal forces rather than element stresses, making the results independent of mesh density — an essential advantage at sharp weld toes where stress-based methods produce mesh-dependent (non-converging) results. Two S-N curves were used: one for pure bending and one for membrane (tensile) loading, with the actual bending ratio at each element used to interpolate between the two. The load cycle was defined as a constant-amplitude oscillation from 0 to −500 mbar.
Results
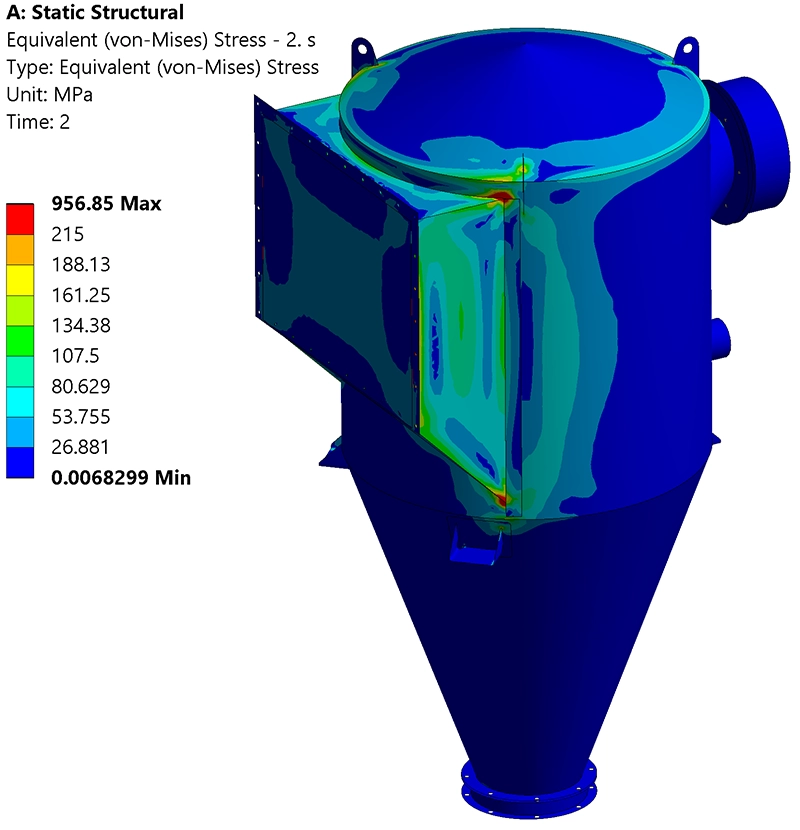
Original design (Model v1)
The stress analysis confirmed that locations A and B are the most highly loaded areas in the entire bunker. The stresses at these junctions far exceed the surrounding plate stresses, which is consistent with the observed crack locations. The fatigue analysis of the four critical welds revealed significant differences in predicted life. The most critical weld at location A had a predicted life of only approximately 20,000 cycles — equivalent to roughly 3,000 operating hours. The other welds at location A showed predicted lives ranging from approximately 700,000 to 750,000 cycles. At location B, the most critical weld had a predicted life of approximately 48,000 cycles (~7,400 hours).
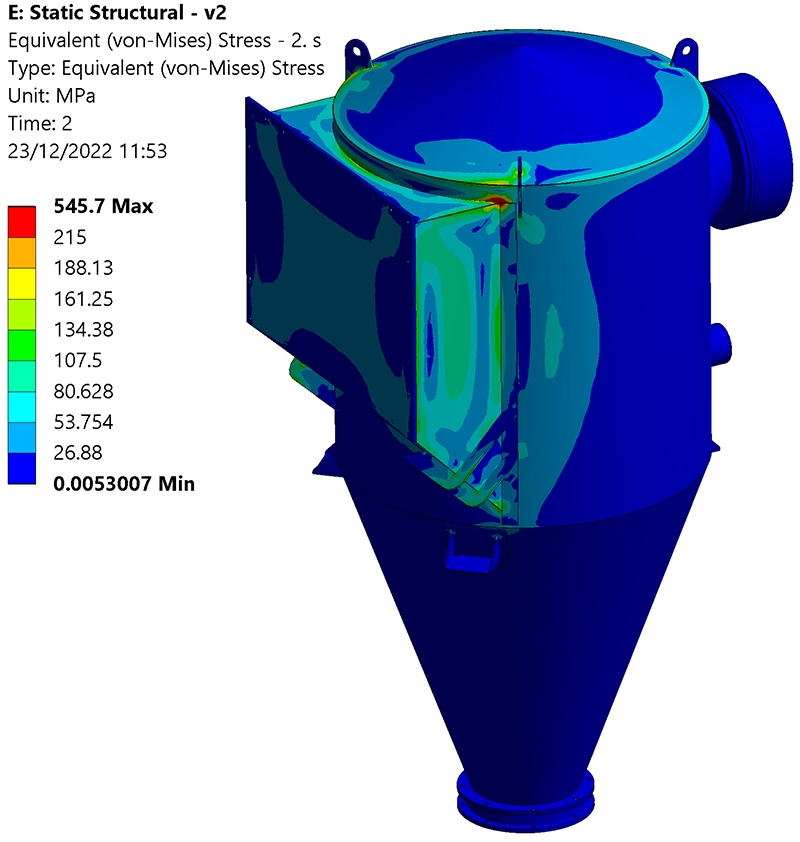
Reinforced design (Model v2)
In the second design variant, reinforcement ribs were added at the base of the conical hopper section to relieve the stress concentration at location A. This modification produced a dramatic improvement: the critical weld at location A saw its fatigue life increase by a factor of 15.5, from roughly 20,000 cycles to over 300,000 cycles. The other welds at location A improved by factors of 3.5 to 8.1. The improvement at location B was more modest (factor 1.8), which is expected since the reinforcement ribs are positioned further from that junction.
The analysis also highlighted that predicting absolute weld fatigue life carries inherent uncertainty. Factors such as weld toe geometry, weld quality and residual stresses vary significantly from weld to weld. While the absolute life figures should be interpreted with appropriate engineering judgement, the relative comparison between the two designs is robust and provides a reliable basis for the design decision.
Value Delivered
The combined FEA and fatigue analysis provided the client with a clear root-cause explanation for the observed weld cracking, confirmed by the correlation between the predicted critical locations and the actual crack locations found in service.
Beyond the diagnosis, the study delivered a quantified comparison of the original and reinforced design, showing that the proposed reinforcement ribs improve the most critical weld life by more than an order of magnitude. The report also outlined further improvement strategies, including weld toe grinding, shot peening and high-frequency impact treatment (HFMI), which could be applied in combination with the geometric modification to further extend the service life. These recommendations gave the client a prioritised roadmap for resolving the fatigue issue, combining immediate geometric changes with longer-term weld quality improvements.
Dealing with weld cracking or fatigue failures?
Whether you need to investigate an existing failure, predict the fatigue life of a new design or evaluate structural modifications, we can help. Get in touch for a free initial consultation.
Contact us or call us at +32 478 618 118