The Challenge
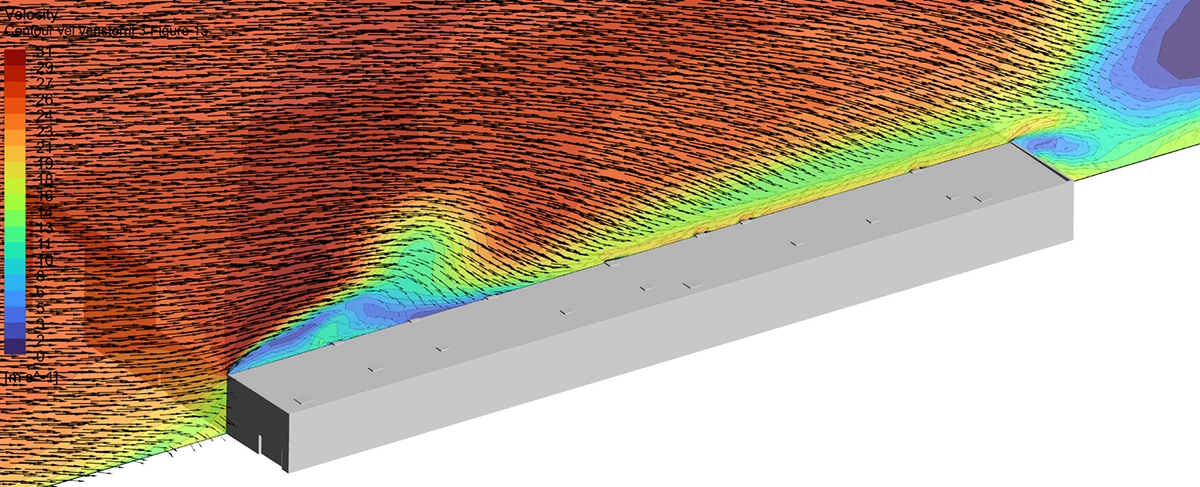
A large warehouse in the port of Ghent, Belgium, is situated directly adjacent to a tall terminal building approximately four times its height. This significant height difference creates complex aerodynamic interactions: wind accelerates over the taller structure and generates zones of increased suction on the lower warehouse roof that standard analytical methods according to EN 1991-1-4 cannot accurately predict.
The warehouse roof contains 25 operable roof windows. The building owner needed to determine the wind pressure and wind suction acting on each of these windows under design wind conditions, accounting for the aerodynamic interference of the adjacent tall building. These values were required to verify that the windows' structural capacity is sufficient and to determine the horizontal and vertical wind forces on each window for three critical wind directions.
Our Approach
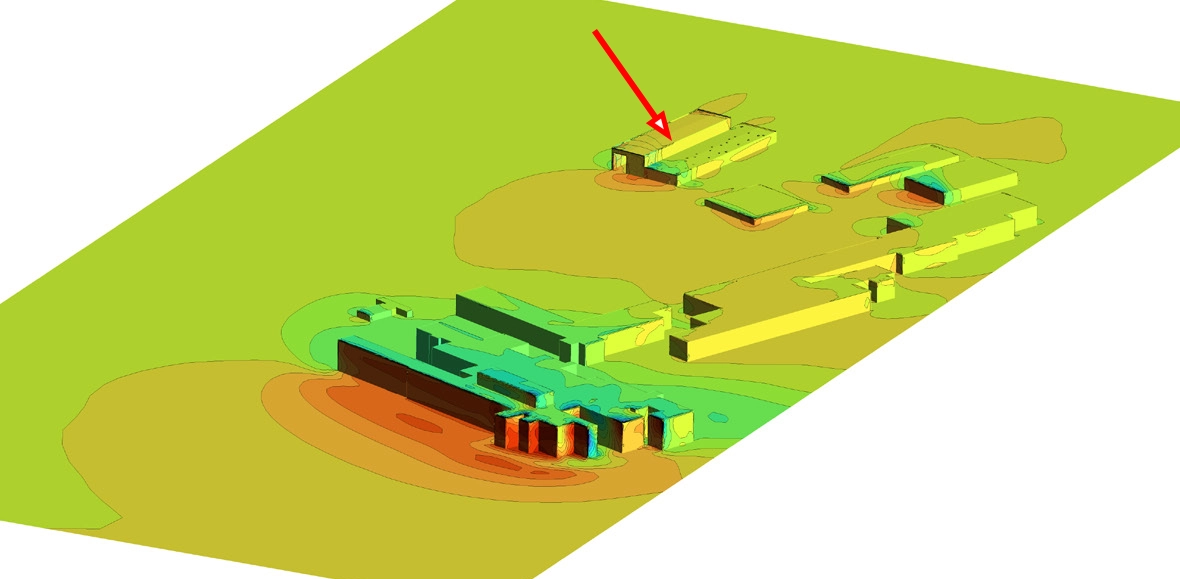
We built a detailed CFD model of the warehouse, the tall terminal building, and the surrounding built environment. The computational domain extended 2,300 m in the wind direction, 1,145 m in width and 295 m in height, allowing the incoming uniform flow to develop into a realistic velocity profile shaped by the upstream terrain and buildings before reaching the structures of interest.
Mesh and turbulence modelling
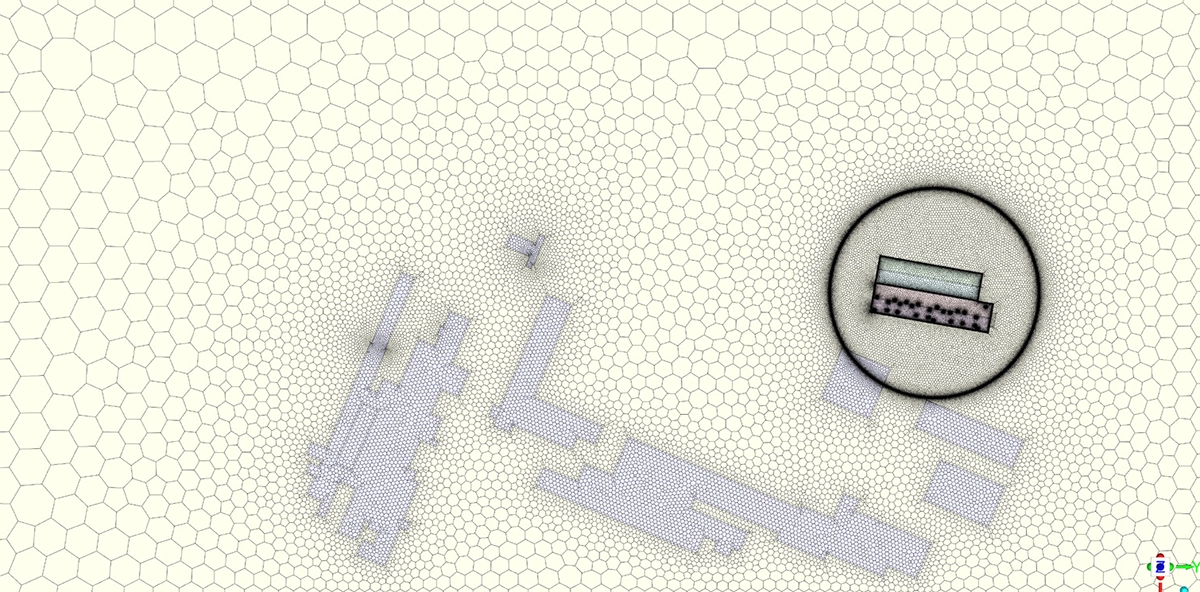
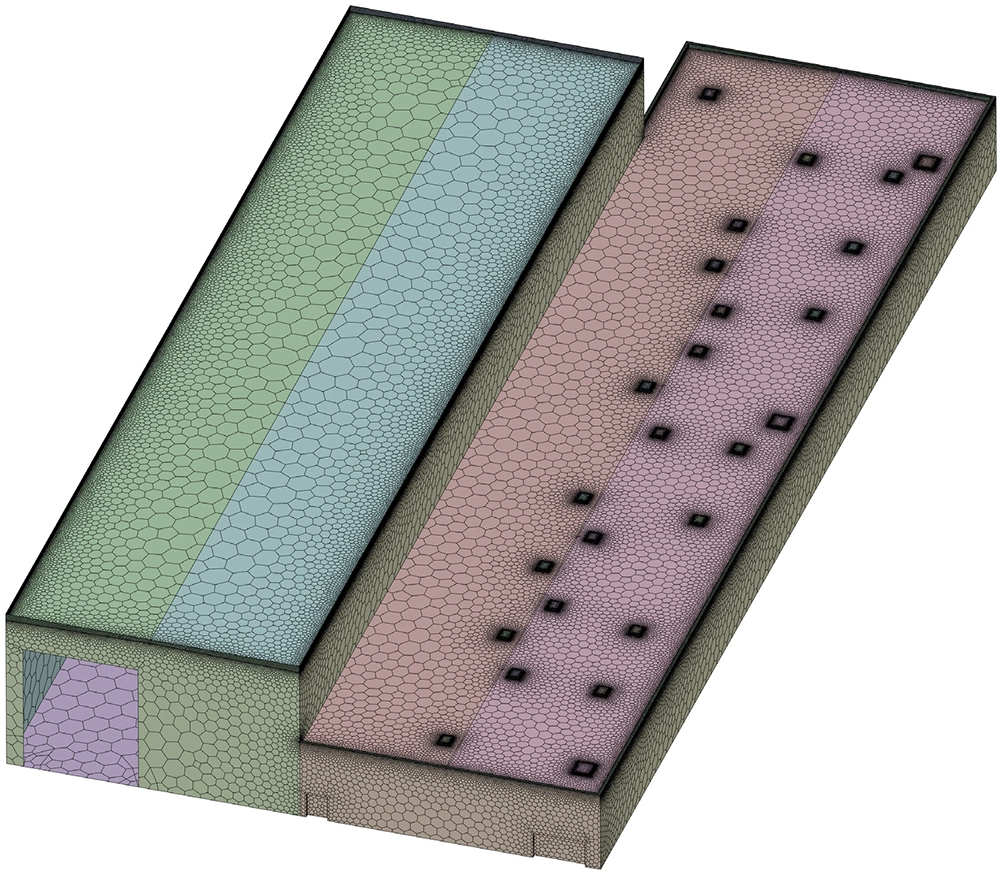
The domain was discretised with approximately 78 million polyhedral cells, with refined zones around the warehouse roof, the 25 roof windows and the interface between the two buildings where the strongest aerodynamic interaction occurs. The simulations were run as steady-state RANS analyses using the k-ω SST turbulence model in Ansys Fluent, solving for the time-averaged pressure and velocity fields.
Three wind directions
Three separate simulations were performed for a design wind speed of 26 m/s, corresponding to the wind directions south, southwest and west. These directions were selected because they represent the most critical orientations for this particular site geometry, where the tall building either directly deflects airflow onto the warehouse roof or creates strong vortex shedding at its edges.
Peak pressure correction per EN 1991-1-4
Since a standard RANS simulation calculates time-averaged pressures and does not resolve short-duration wind gusts, we applied correction factors according to EN 1991-1-4 to convert mean pressure coefficients into peak pressure coefficients. A gust factor was derived from the turbulence intensity at the warehouse roof height, and a terrain roughness factor was calculated for the applicable terrain category. Together, these correction factors ensure that the reported peak pressures and peak forces are conservative and directly comparable to the design values that structural engineers work with.
Results
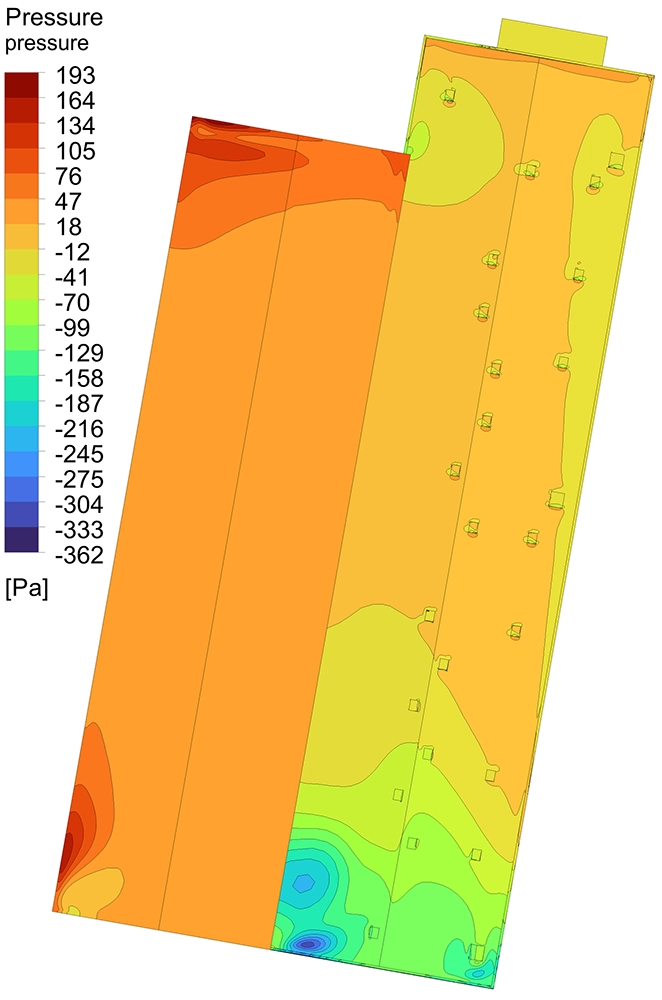
The CFD analysis revealed distinctly different pressure distributions on the warehouse roof depending on the wind direction. For south wind, the roof was predominantly under suction, with peak suction occurring near the southern edge where the airflow separates after being deflected by the tall building. The southwest wind direction produced the most severe loading overall: the combination of direct wind exposure and flow acceleration around the tall building's corner generated peak suction pressures roughly three times higher than the south wind case.
For west wind, the warehouse lies fully in the aerodynamic shadow of the tall terminal building. This sheltering effect resulted in relatively uniform but moderate suction across the entire roof. While the suction magnitudes were lower than the southwest case, the uniformity means that all 25 roof windows are subjected to similar loads simultaneously.
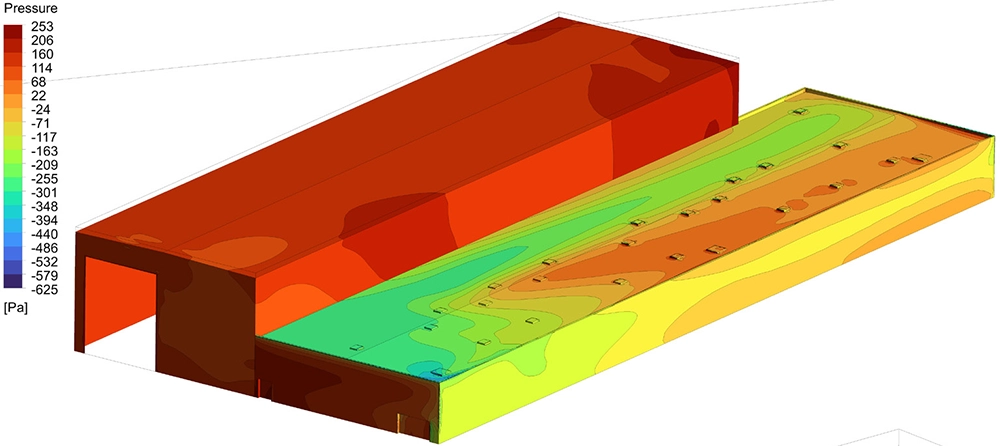
Across all three wind directions, each of the 25 roof windows was characterised in terms of mean static pressure, peak static pressure, peak pressure coefficients, and horizontal and vertical forces. These results were tabulated per window and per wind direction, providing the structural designer with a complete dataset for the window verification.
The highest peak suction on the overall roof area occurred for the southwest wind direction, with a peak pressure coefficient of −3.64 and a corresponding peak pressure of −1,537 Pa. This was significantly more severe than the south wind case (−549 Pa) and the west wind case (−891 Pa), confirming that the southwest direction governs the design of the roof structure. At the individual window level, the highest vertical force on any single window reached approximately 3,880 N under southwest wind — a value that would not have been predicted accurately by simplified code methods alone, given the complex aerodynamic interference from the adjacent tall building.
Value Delivered
By using CFD simulation rather than relying solely on the simplified pressure coefficient tables in EN 1991-1-4, we captured the real aerodynamic interaction between the tall terminal building and the lower warehouse — an interaction that standard code methods are not designed to handle. The tabulated pressure and force results per window and per wind direction gave the structural engineer exactly the input data needed for the window verification and for the assessment of the roof fastening system.
The contour plots of mean and peak pressure coefficients across the entire roof also provided a clear visual map of the critical zones, enabling the designer to prioritise reinforcements where they matter most. Beyond the immediate window verification, these results serve as a reference for any future modifications to the warehouse roof, such as the addition of solar panels or new penetrations.
Need accurate wind loads on your structure?
When standard code methods fall short — due to complex geometry, adjacent buildings or unusual terrain — a CFD wind study delivers the detailed pressure data your design team needs. Get in touch for a free initial consultation.
Contact us or call us at +32 478 618 118